1502
Proceedings of the 18
th
International Conference on Soil Mechanics and Geotechnical Engineering, Paris 2013
Proceedings of the 18
th
International Conference on Soil Mechanics and Geotechnical Engineering, Paris 2013
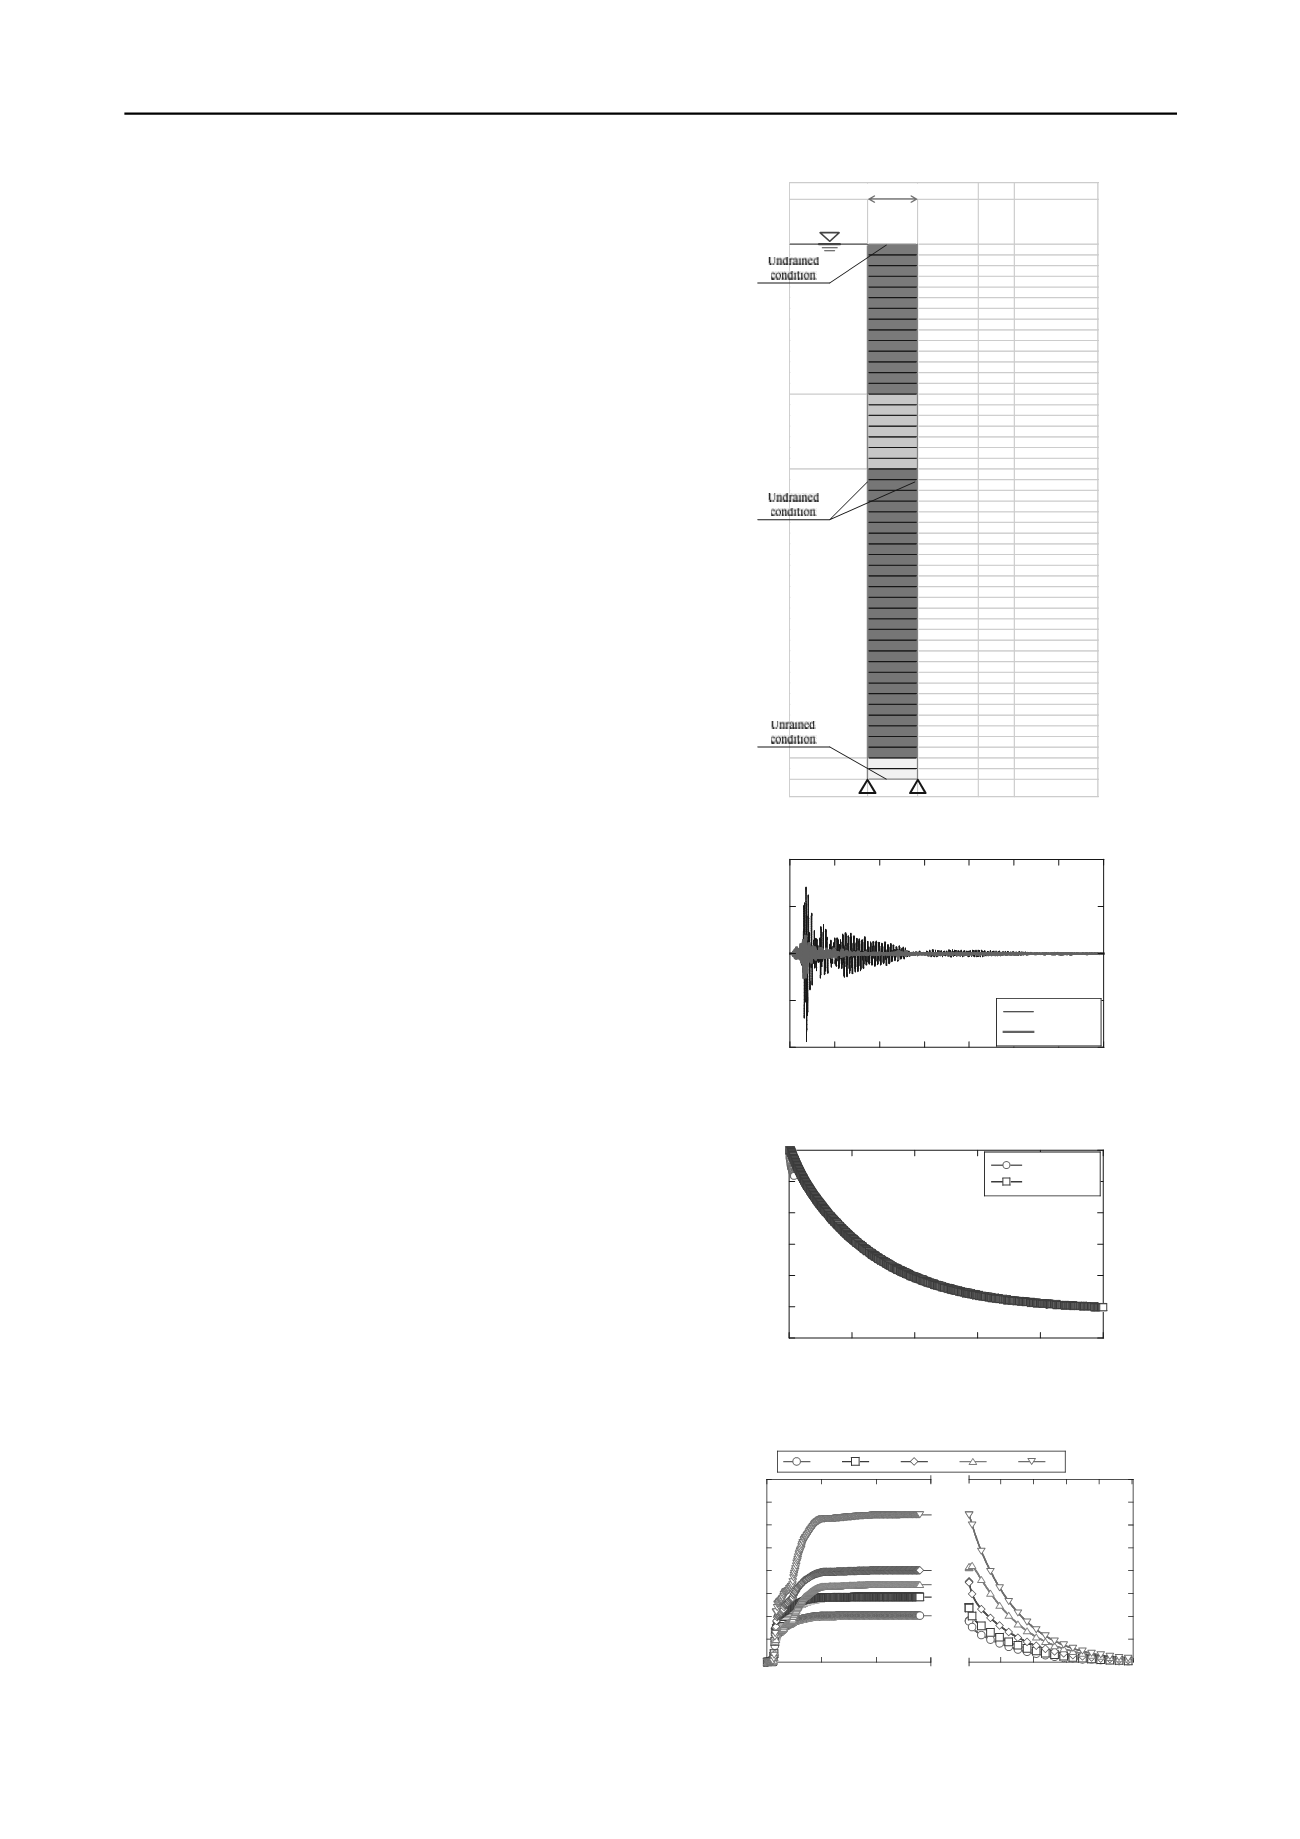
In the numerical simulation, the process of shaking is
represented via dynamic soil-water coupled analysis, while the
process of EPWP dissipation is simulated via static
consolidation analysis. As the whole process is continuous, it
should be simulated as an ongoing sequence. The simulation is
divided into two stages as follows: (a) dynamic analysis is
conducted for 280 seconds until shaking stops, and (b)
consolidation is conducted over a period representing 150 years
until EPWP dissipates completely. The initial stress field is
calculated in advance via self-weight static analysis, and the
values of initial stress for each element are shown in Figure 13.
The value of the initial OCR is based on that of the initial stress
and the clay’s consolidation yield pressu
re. Figure 7 shows the
input wave used in the simulation as applied at the bottom of
the analytical domain. Stiffness proportional damping with a
ratio of 5% was applied for the damping model, and the
Newmark-
method was used for time integration.
Figures 7 through 9 show time histories of response
acceleration at the ground surface, cumulative ground
subsidence of the layer from the ground surface to a depth of 23
m and the excess pore water pressure ratio (EPWPR). It can be
seen from these figures that response acceleration at the ground
surface was amplified up to 500 Gal and that slight shaking
lasted until 100 sec. Ground subsidence began to gradually
increase soon after the shaking finished, showing close
correspondence to the observation results, and continued for
150 years with a cumulative total of 250 mm. This subsidence
was caused by the generation of EPWP in the shallow clayey
layer due to shaking, and pressure dissipation took such a long
time
because of the ground’s low permeability. Although E
PWP
generation was also observed in the silt layer, cumulative
ground subsidence was less than that in the clayey layer because
the compression and swelling index values and the degradation
parameter of the over-consolidation state were smaller.
5 CONCLUSIONS
The findings of the study can be summarized as follows:
1. Ground subsidence observed before the 2007 Niigata
Prefecture Chuetsu-Oki Earthquake was caused by ground
water being pumped up.
2. The long-term subsidence observed after the quake can be
explained by the generation of excess pore water pressure
and its slow dissipation. This phenomenon was found to last
for a long time due to low permeability and compression
softening in the structured clay.
3. The seismic intensity of earthquakes has a significant
influence on cumulative subsidence.
4. Based on the simulation results, excess pore water pressure
conditions and ground subsidence can be expected to
continue for more than 100 years after the tremblor.
6 REFERENCES
Asaoka, A., Nakano, M., Noda, T. and Kaneda K. 2000. Delayed
compression/consolidation of natural clay due to degradation of soil
structure.
Soils and Foundations
40(3), 75-85.
Hashiguchi, K. and Ueno, M. 1977. Elastoplastic constitutive laws of
granular material, Constitutive Equations of Soils.
Proc. 9th
ICSMFE
,
Spec. Ses. 9 (eds. Murayama, S. and Schofield, A. N.)
,
Tokyo
,
JSSMFE
, 73-82.
Ye, B., Ye, G., Zhang, F. and Yashima, A. 2007. Experiment and
numerical simulation of repeated liquefaction-consolidation of sand.
Soils and Foundations
47(3), 547-558.
Zhang, F., Ye, B., Noda, T., Nakano, M. and Nakai, K. 2007.
Explanation of cyclic mobility of soils: Approach by stress-induced
anisotropy.
Soils and Foundations
47(4), 635-648.
Figure 6. Finite element mesh and boundary conditions used in
the simulation
Figure 7. Time history of response acceleration on the surface
Figure 8 Time history of cumulative ground subsidence in the
layer from the ground surface to a depth of 23 m
Figure 9. Time history of the excess pore water pressure ratio
Depth [m] OCR
Initialmean
effective stress
[kPa]
1
18.42
7.5
2
11.02
12.6
3
7.87
17.6
4
6.11
22.7
5
5.00
27.7
ele.45
6
4.23
32.8
7
3.67
37.8
8
3.23
42.9
9
2.89
47.9
10
2.62
52.9
11
2.39
58.0
12
2.20
63.0
13
2.04
68.1
14
1.89
73.1
15
1.81
78.4
ele.35
16
1.69
83.8
17
1.59
89.2
18
1.50
94.6
19
1.42
100.0
20
1.35
105.5
21
1.28
110.9
22
2.50
117.0
23
2.50
123.9
24
2.50
130.7
25
2.50
137.6
ele.25
26
2.50
144.5
27
2.50
151.3
28
2.50
158.2
29
2.50
165.0
30
2.50
171.9
31
2.50
178.8
32
2.50
185.6
33
2.50
192.5
34
2.50
199.3
35
2.50
206.2
ele.15
36
2.50
213.1
37
2.50
219.9
38
2.50
226.8
39
2.50
233.6
40
2.50
240.5
41
2.50
247.4
42
2.50
254.2
43
2.50
261.1
44
2.50
267.9
45
2.50
274.8
ele.5
46
2.50
281.7
47
2.50
288.5
48
2.50
295.4
49
-
303.2
50
-
312.0
Gravel
Deep layer
clay
Silt
shaking direction
Shallow layer
clay
-500
-250
0
250
500
Response
Input
0 40 80 120 160 200 240 280
Response acceleration (gal)
Time (sec)
0
50
100
150
200
250
300
Observaion
Calculation
Cumulated subsidence (mm)
30
60
90
120 150
Time (year)
0.00
0.05
0.10
0.15
0.20
0.25
0.30
0.35
0.40
45m
35m
25m
15m
5m
Excess Pore Water Pressure Ratio
Time
100 200 300
(sec)
(year)
1 30 60 90 120 150


