1504
Proceedings of the 18
th
International Conference on Soil Mechanics and Geotechnical Engineering, Paris 2013
(Broms and Casparian 1965, Symes et al. 1984, Uthayakumar
and Vaid 1998, Sivathayalan and Vaid 2002). Therefore; the
more critical location may be away from the foundation
centerline, even though the major principal stress magnitude is
less compared to the one below the centerline.
Considering the inadequacy and also the inherent limitations
of CT (Cyclic Triaxial) and CSS (Cyclic Simple Shear) tests,
cyclic HC tests have gained more popularity for the
investigation of the effect of cyclic loads on the soil behavior
(Ishihara and Yamazaki 1983, Tatsuoka et al. 1984, Ishihara et
al. 1985, Tatsuoka et al. 1986, Koester 1992, Altun et al. 2005).
In this study the effect of changing in intermediate principal
stress ratio (b) on cyclic behavior and dynamic parameters of
Babolsar sand has been investigated. In all tests the direction of
the major principal stress was kept in vertical direction (α=0)
and intermediate principal stress ratio changed from a test to
another one to cover the range of variation of b value. For a
closer look of this trend, tests were conducted in two different
mean normal effective stresses.
2 EXPERIMENTAL APPARATUS
Advanced testing of geomaterials requires accurate control of
loads or deformations. Recent advances in the manufacturing of
testing equipment have eliminated the role of the operator in
modern systems. Most tests are conducted via closed loop
control mechanisms, which may involve servo hydraulic or
servo pneumatic systems. The closed-loop control system of the
dynamic HC apparatus used in this study has five main
components: (1) HC software, (2) high-speed data acquisition
system (DAS), (3) servo valves, (4) vertical and horizontal
actuators, and (5) load, pressure and displacement transducers.
The apparatus used in this study is made by Wykeham
Farrance International Company.
3 SAMPLE PREPARATION AND TESTS PROCEDUR
The original material used in this study was Babolsar sand
obtained from Caspian Sea coast in Babolsar, Iran. This uniform
sand was sieved to get the tested material, which has mean
particle diameter D
50
= 0.22
mm
, effective particle diameter D
10
= 0.14
mm
, a minimum void ratio e
min
= 0.543 and a maximum
void ratio e
max
= 0.820. The particles image is illustrated in
Figure 1. In this picture the grain size and shape of Babolsar
sand particles are evident. It is clear that particles are in the
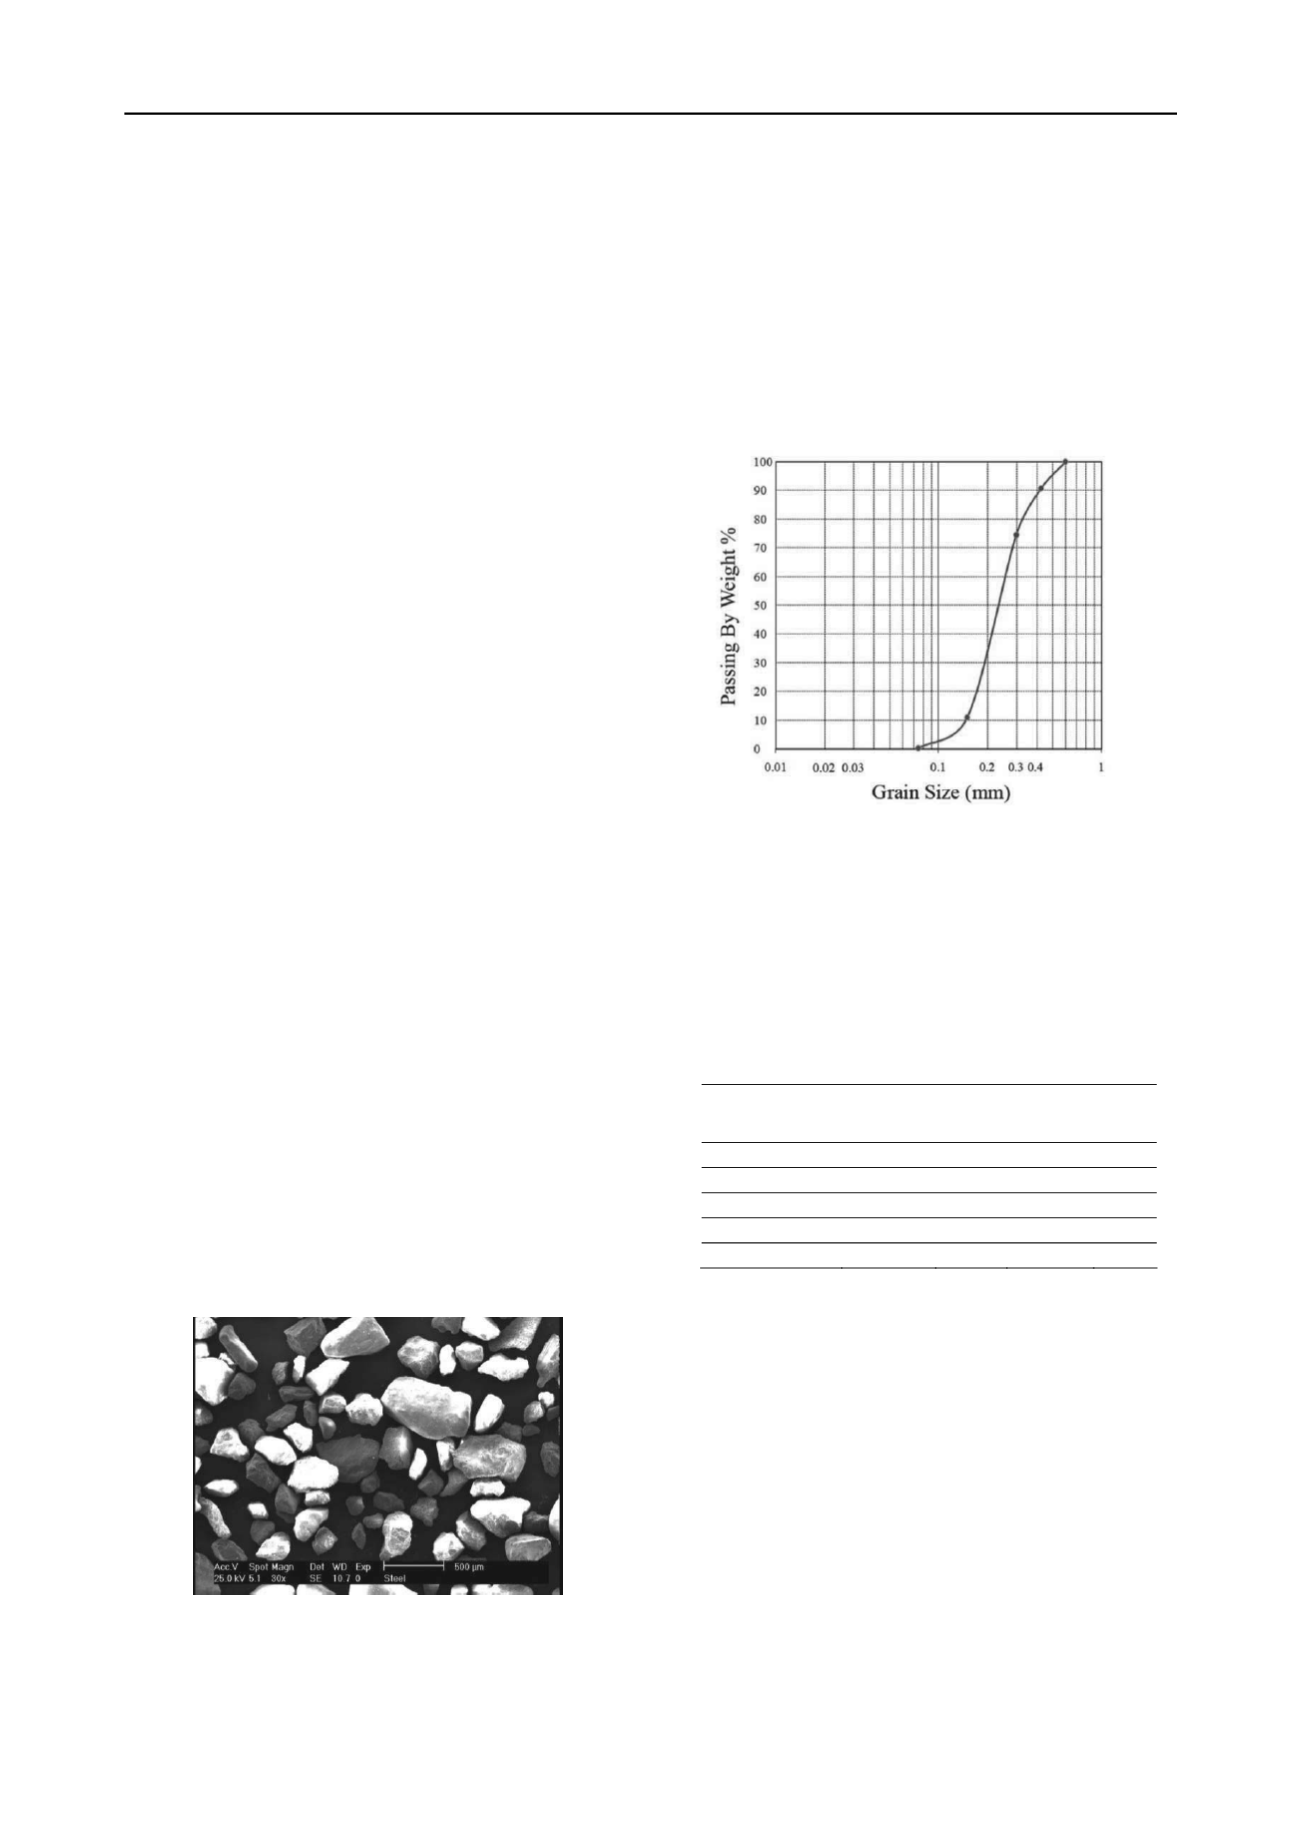
same size and partly angular. Grain size distribution of this sand
is shown in Figure 2. This sand classified as poorly graded sand,
SP; according to the Unified Soil Classification System. The
wet tamping method was used for preparation of the samples.
The samples were prepared to obtain relative densities in the
range of Dr = 22% ~ 25% after consolidation.
Figure 1. Particles image of Babolsar sand.
After construction of the samples, first CO
2
gas and then de-
aired water are passed through them. Next stage includes the
full saturation of the samples by applying inner, outer and back
pressure increments. This stage will continue to reach the B
value more than 0.94.
After that, the samples were isotropically consolidated to
reach 150 kPa mean normal effective stress.
Induced cyclic deviator stress was imposed under stress
controlled condition. In all tests the rate of induced cyclic
deviator stress to initial mean normal effective stress set as 0.27.
For keeping α and b constant during loading, the vertical
load and torque values were applied simultaneously as a cycle.
The purpose of this study is to investigate the effect of stress
anisotropy caused by changing in principal stress direction on
dynamic behavior of sand. 5 tests under controlled state of
principal stress direction were conducted.
Figure 2.Grain size distribution of Babolsar sand.
In these tests the inner and outer cell pressures were same,
therefore; the intermediate principal stress parameter is related
to the principal stress direction by Eq.1.
b = sin
2
(α) (1)
Detail information of the specimens and their loading details
for the mentioned tests are shown in Table 1.
Table 1. Detail information of the specimens
Specimens Id.
Dr(%)
σ'
0
(kPa)
α
(degree)
b
15010
83
150
10
0.03
15030
87
150
30
0.25
15045
84
150
45
0.5
15060
83
150
60
0.75
15080
86
150
80
0.97
4 TEST RESULTS AND DISCUSSIONS
The maximum shear stress in an element of hollow cylinder
samples is a resultant of two shear stresses. The first is a shear
stress arisen from torque (τ
zh
) and another is result of vertical
and horizontal stresses difference ((σ'
z
-σ'
h
)/2) or deviator stress.
The maximum deviator stress can be calculated from (σ'
1
-σ'
3
)/2.
As it was mentioned before, in these tests the samples are in the
same condition of fabrication and consolidation and the cyclic
load are imposed on the specimens under the controlled state of
the α and the rate of maximum deviator stress to mean normal
effective stress ((σ'
1
-σ'
3
)/2σ'
0
). Figure 3 shows these stress paths
of torsional shear stress and deviator stress. With regard to
Figure 3, during a test, the specimens are in triaxial compression
and triaxial extension state at α=10
o
and 80
o
loading condition,
respectively; and α=45
o
is associated by pure shear state.
Figure 4 shows the excess pore water pressure ratio (r
u
)
generation with shear deformation in tests with different α.
Results show that pore water pressure generation trend has
three phases. In the first phase, the pore water pressure


