1513
Technical Committee 203 /
Comité technique 203
Table 5 shows the results of the calculations with the FE
method.
Table 5. Final displacements and safety factors with the FE method.
Phase
δ
max
(mm)
Safety factor
Initial
1.44
Reservoir at 207.5 level
1.43
Drawdown
193
1.47
Fill
1300
1.36
Long term
2060
1.79
Earthquake & liquefaction 278
1.19 (inside tailings)
5 DYNAMIC CALCULATION
The NCSR 2002 considers that large dams (height greater than
15 m) are constructions of special importance, which should be
calculated for a return period of 1,000 years. The seismic
acceleration for pseudo-static calculation was 0.08g. The
reinforcement has been calculated using this acceleration. The
ITC (2000) required a safety factor of 1.3.
A dynamic calculation has being carried out. A method to select
accelerograms (Morales-Esteban et al., 2012), for the closure
calculation, has been developed based on uniform seismic
hazard response spectra and is detailed in the paper.
The arrival of earthquakes to the site that exceed a reference
value log
S
0
is modelled as a Poisson stationary process, defined
according to the Gutenberg-Richter law. The seismogenic areas
defined by Martin (1984) were used.
Next, the uniform seismic hazard response spectra are
calculated. The arrival of earthquakes to the site that exceed a
reference value log
S
0
is modelled as a Poisson stationary
process, defined according to the Gutenberg-Richter law.
For source
i,
the average number of events per year is:
(1)
where:
ν
i
is the seismic rate of earthquakes of the individual source.
P
is the probability for log
S
to exceed the reference value,
log
S
0
, for an earthquake of magnitude
M
that occurs at a
distance
D
from the site.
f(
M
) is the magnitude probability density function between the
minimum and maximum magnitudes considered.
If
N
individual seismic sources act simultaneously, the rate
λ
of arrivals at the site of earthquakes that exceed the reference
value, log
S
0
, is:
λ =
Σ
λi
(2)
The return period,
T
, is the average time interval between
events and its value is:
T
= 1/
λ
(3)
The probability of exceeding the reference value log
S
0
during the period of time,
t
, owing to the simultaneous action of
N
individual seismic sources is:
P
(logs ≥ log
S
0
;
t
) =1-e
-
λt
(4)
Equation (1) cannot be applied to the hazard calculation as
the seismogenic areas have been modeled as areas and not as
punctual seismic sources. To solve this problem, the
seismogenic areas are divided into elements small enough to be
assimilated to punctual seismic sources.
With this procedure, uniform seismic hazard response
spectra can be created for the site according with the period of
exposure, the probability of exceeding the design spectrum and
the type of soil. Then real design accelerograms can be selected
following these steps:
-The period of exposure of structure is established according
to its estimated lifetime.
-The probability of exceeding this level is established
according to the seismic hazard required. In this case, as the
return period is established (1,000 years), the probability is
calculated using equations (3) and (4).
For the type of soil at the site, the uniform seismic hazard
response spectrum is calculated according to the required
seismic hazard level.
From the database of accelerograms, those recorded at the
same type of soil are selected.
The standard deviation is defined as:
2/1
2
/])
log
.
log(
n S
Sf
S
C
R
(5)
where:
(6)
n S
S
f
R
C
/)
log
log
Here
S
R
are the values of the response spectrum
corresponding to the real register,
S
C
are the values of the
calculated response spectrum,
n
is the number of intervals
considered in the calculation and
f
is the scale factor that
minimizes the standard deviation.
This methodology has been applied to the site of Almagrera
Dam, founded on rock, for a damping ratio of 5%, considering a
return period close to 1000 years. The accelerograms have been
selected from the European Strong Motion Database that can be
obtained from Internet at
/.
Figure 5
shows the comparison between the response spectrum
calculated for Almagrera dam, in rock, for 1000 years return
period, and the response spectrum from one of the selected
accelerogram.
max
min
) ( ) , /
log
(log
0
M
Mi
i
dmMfDMS
S P
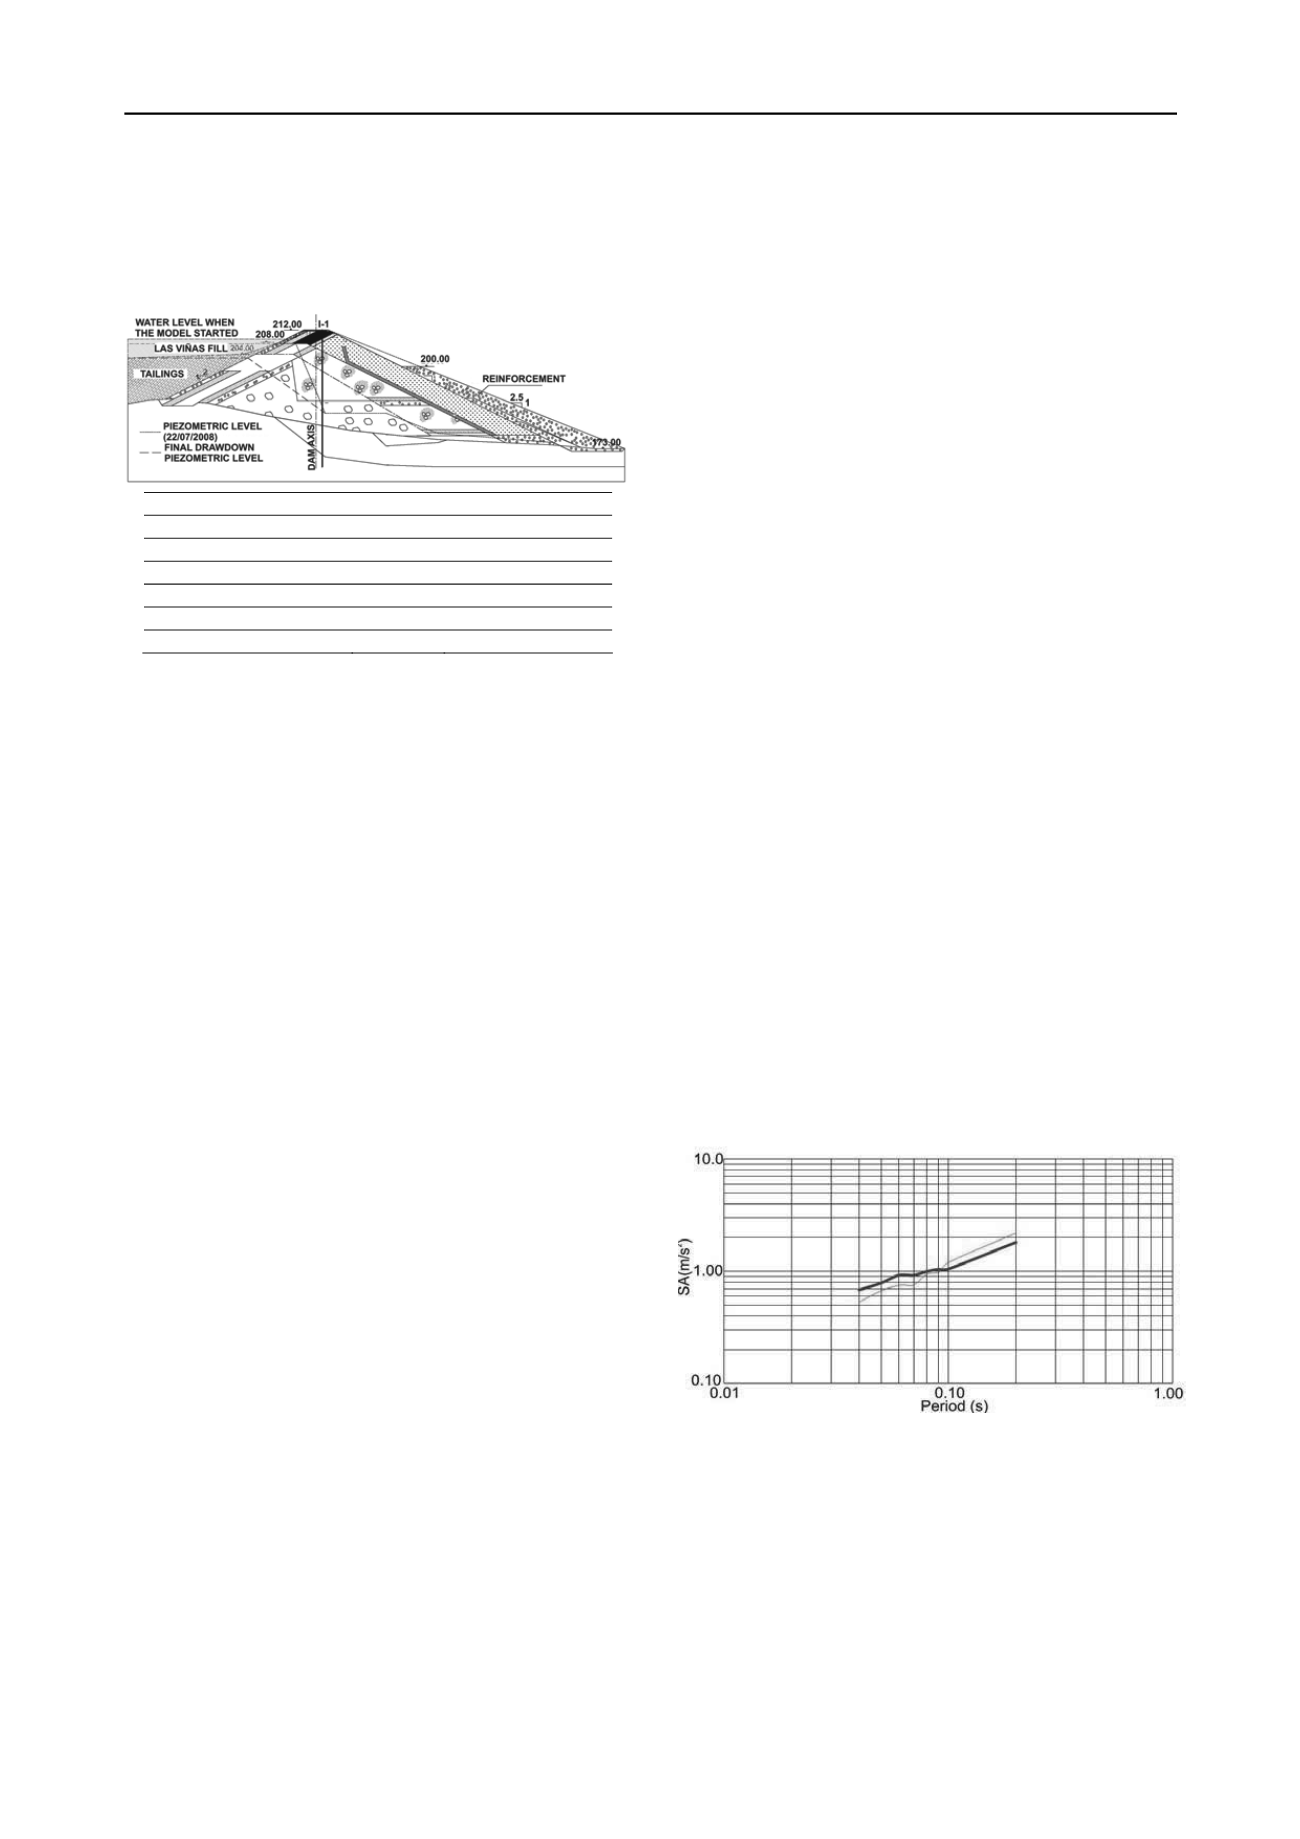
Uniform seismic hazard response spectrum (clear line).
Spectrum for accelerogram 7488 (dark line).
Figure 5. Comparison between the response spectrum calculated for
Almagrera dam, in rock, for 1000 years return period, and the response
spectrum from the selected accelerogram.
From the database, the accelerograms that have a scale factor
near to 1, and a smaller standard deviation are finally selected
(Table 6)


