1514
Proceedings of the 18
th
International Conference on Soil Mechanics and Geotechnical Engineering, Paris 2013
Table 6. Selected accelerograms, scale factor and standard deviation.
Accelerogram
f
s
128
0.991
0.016
361
1.016
0.028
365
0.931
0.130
608
1.099
0.172
990
1.006
0.011
5826
0.931
0.129
6269
1.095
0.165
6270
1.014
0.026
6331
0.969
0.057
7480
1.033
0.058
Once the accelerograms have been selected, they are not
scaled to be introduced in the dynamic calculation. One of these
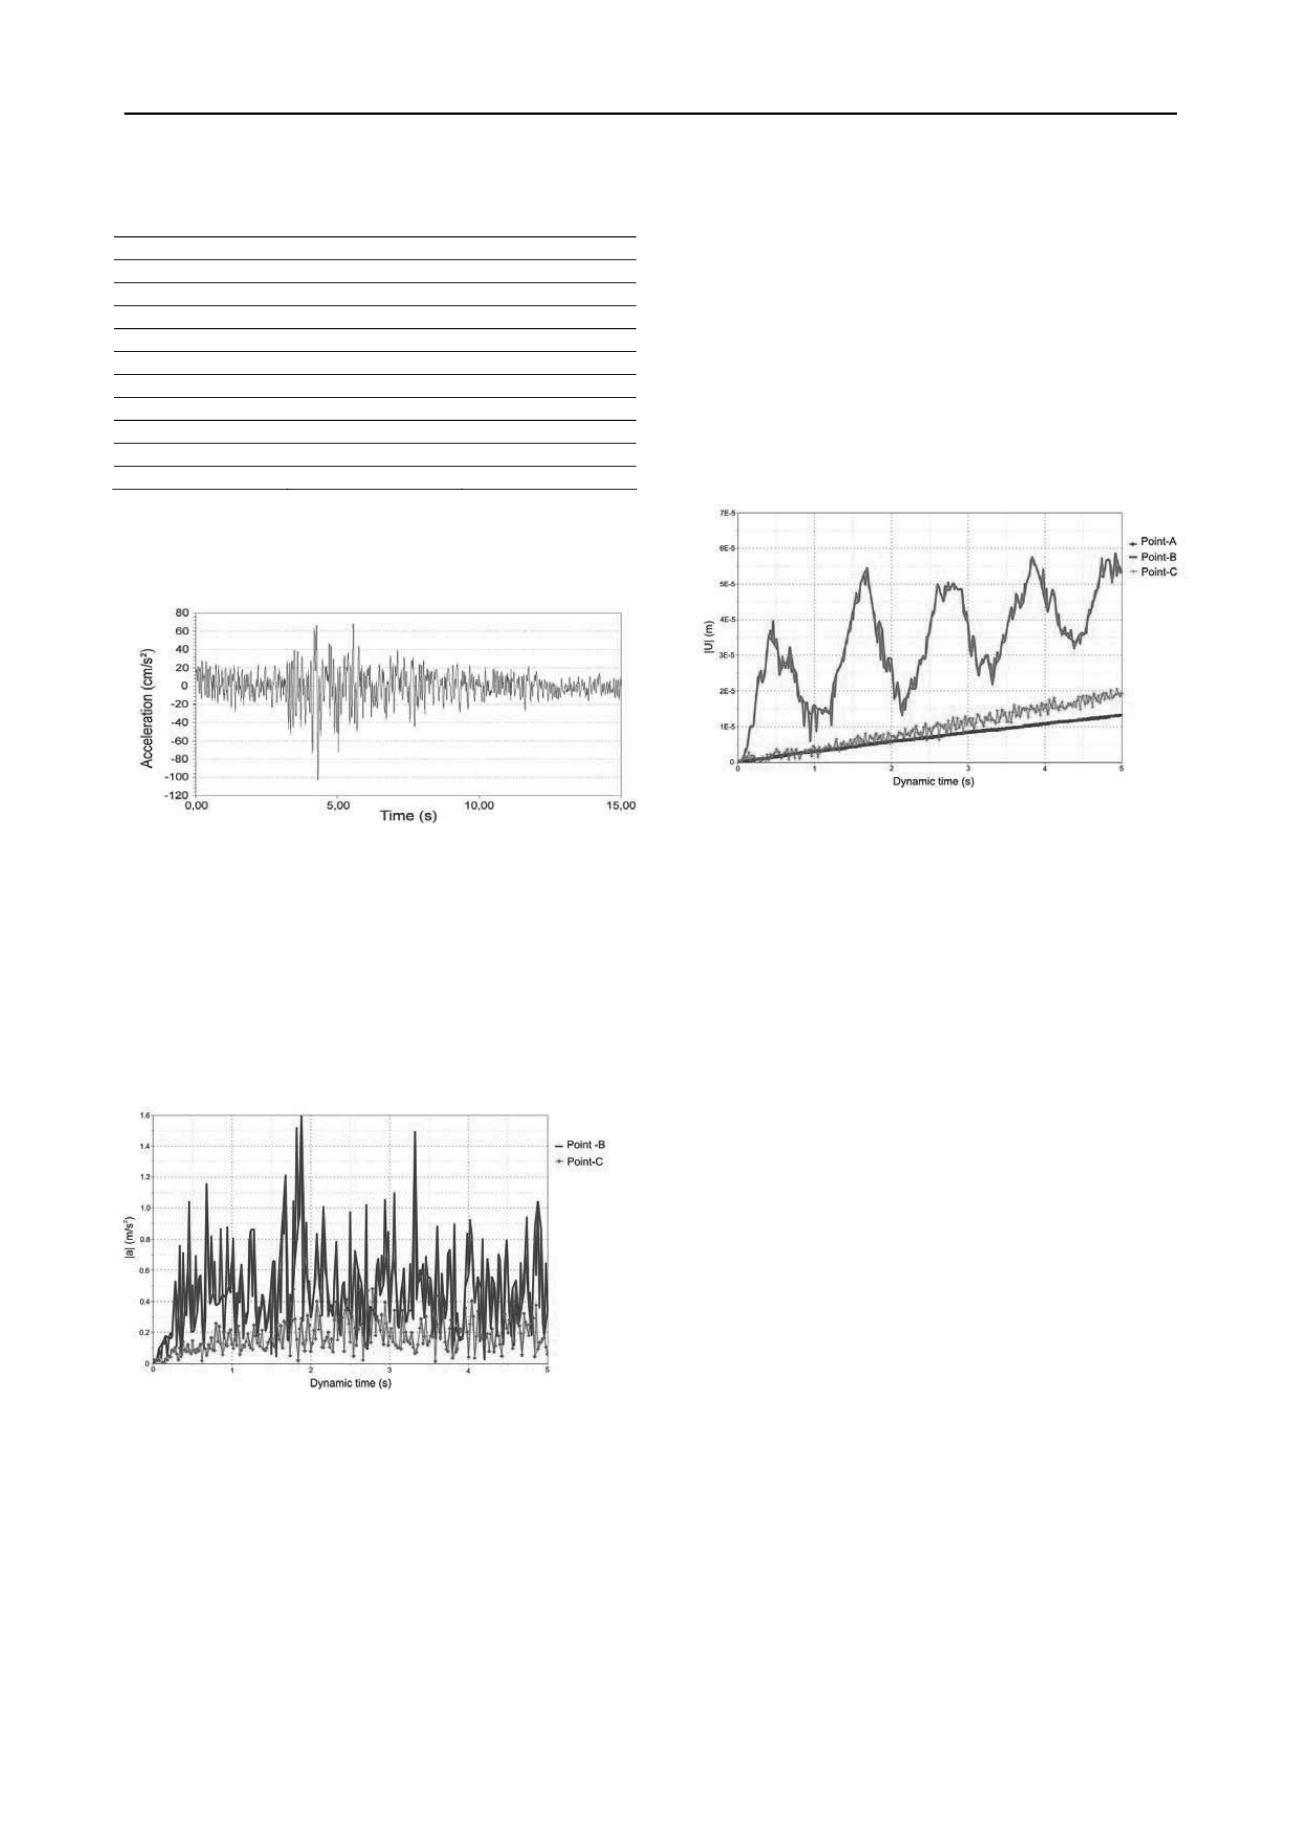
accelerograms selected is shown in Figure 6.
Figure 6. Accelerogram No. 128. Scale factor for all periods 0.99.
From the dynamic calculation the acceleration versus time of any
point of the dam subjected to the accelerograms selected can be
obtained as plot in figure 7. Similar is figure 8 where the displacement
is shown versus time. Absolute displacement can be obtained by
subtracting the displacement of the point to the displacement of point A
(placed on the basement). Finally, in the figures corresponding to the
relative shear stresses, obtained from Plaxis output, plastic zones appear
in the downstream slope, in the tailings and elsewhere. It can be
observed that no continuous surface of rupture appears.
Figure 7. Total acceleration versus time during 5 seconds of calculation
with accelerogram 608. Selected points: B over the dam and C at the left
side.
6 CONCLUSIONS
A model, reproducing all the closure operations, has been
prepared, and results presented herein. Monitoring has been
provided that will verify and improve the model
presented. Several closure aspects have been examined:
1. The placement, above the tailings, of coarse mineral
residues, thereby reducing the volume of mine dumps.
2. Methods to speed up settlements before placing the cover
and, this way prevent damage to it; for example the placement
of band-shaped drains, inside the tailings, after the fill has been
placed on them.
3. A method to select accelerograms for the closure
calculation has been developed based on uniform seismic
hazard response spectra and is detailed in the paper.
4. Dynamic calculation has shown that relative
displacements are small and that no surface of rupture appears.
The model has indicated the necessity to place rockfill
reinforcement downstream.
As it may be observed, the calculated dynamic
displacements are quite small. Further calculations are being
carried out with larger return periods, as indicated by standards
specifically related to tailings dams.
Figure 8. Total displacement versus time for the selected points during 5
seconds of calculation with accelerogram 608. Selected points: A on the
base, B over the dam and C at the left side.
7 ACKNOWLEDGEMENTS
This work has been financed by the Spanish Ministry of Science
and Innovation (Project BIA 201020377).
8 REFERENCES
Davies M.P. 2002. Tailings impoundments failures: Are geotechnical
engineers listening?
Geotechnical News
, September: 31-36.
Davies M.P. and Martin T.E. 2000. Mine tailings dams: when things go
wrong. Tailings dams 2000, Proceedings ASDSO Conference, Las
Vegas.
ITC 2000. Instrucción Técnica Complementaria 08.02.01 del capítulo
XII del
Reglamento General de Normas Básicas de Seguridad
Minera Depósitos de lodos en procesos de tratamiento de
industrias extractivas
. BOE de 9/6/2000, 17235-17244. Ministery
of Industry & Energy (Spain).
Martín A.J. 1984. Riesgo sísmico en la Península Ibérica. Tesis
doctoral.
Ph. D. Thesis
, Politechnical University of Madrid.
Morales-Esteban A. de Justo J.L. Martínez-Álvarez F. and Azañón J.M.
2012. Probabilistic method to select calculation accelerograms
based on uniform seismic hazard acceleration response spectra.
Soil
Dynamics and Earthquake Engineering
, 43, 174-185.
NCSR 2002.
Norma de Construcción Sismorresistente NCSR-02. Parte
General y Edificación
. BOE, 244: 35898-35967.


