1516
Proceedings of the 18
th
International Conference on Soil Mechanics and Geotechnical Engineering, Paris 2013
increase of lateral earth pressure. Consequently, soils are more
susceptible to liquefy as water table is near to the ground
surface and, according the European standard, it is not
necessary to investigate the potential of liquefaction for a depth
greater than 15 m (Eurocode 8). However, the limit of the
investigation depth and by the way of the validity area for the
commonly used semi-empirical methods depends on the
available data: for example, methods presented from Youd et al.
(2001) rely principally on data collected in Holocene alluvial or
fluvial sediment and for depths under 15 m and, for values
beyond 15 m, it is indicated that simplified procedure is not
verified with collected data.
Additional screening criteria to exclude the likelihood of
liquefaction triggering, which are considered neither in
Eurocode nor in the report of the NCEER and NCEER/NSF
workshops are available. For example, Day (2002) gives a
screening criterion based on loading characteristics: liquefaction
is excluded if the both conditions a
max
< 0.10g and M
L
< 5 are
fulfilled, where a
max
= peak ground acceleration, M
L
= local
magnitude and g = gravitational acceleration. A comparison of
the peak horizontal acceleration and the local magnitude value
is not enough to conclude, but gives additional information
without high time and cost investment.
Criteria which are based on soil properties are discussed in
the next part.
2.3
Recent assumptions about fine grained soils
In a first time, only sandy soils were considered as liquefiable.
As cases of liquefaction were also observed in fine grained
soils, additional criteria were developed. A description of the
state-of-the-art in this area is given by Prakash and Puri (2010,
2012).
In Eurocode, a soil with fines is not susceptible to liquefy in
both following cases:
•
Clay Content > 20 % with Plasticity Index > 10
•
Silt Content > 35 % and N
1
(60) > 20 (see part 4.1)
In the review of Prakash and Puri, it appears that amount and
type of clay minerals and plasticity index are more relevant than
the amount of “clay-size” particles. However, divergences on
the minimal value of Plasticity Index as criterion are observed
between different research reports.
In order to develop proper criteria for fine grained soils with
plasticity, it is suggested to consider the soils separately
depending on their comportment (Idriss and Boulanger 2004
such as 2008, reported from Prakash 2012). With this
classification, comportment of soils with “sand-like behavior” is
better known than liquefaction susceptibility of soils with “clay-
like behavior”, for which it will take a long time before having a
better comprehension of the phenomena.
3 EVALUATION OF THE CYCLIC STRESS RATIO (CSR)
3.1
Methods referenced at of the NCEER and NCEER/NSF
Workshops (Youd et al. 2001)
According to the procedure of Seed and Idriss (1971) the Cyclic
Stress Ratio is calculated on basis of the following relationship
(Youd et al. 2001):
= 0,65 ∙
∙
∙
(1)
where a
max
= peak horizontal acceleration generated by the
earthquake; g = acceleration of gravity;
σ
z
and
σ
’
z
= total and
effective overburden stresses and r
d
= stress reduction
coefficient. The peak horizontal acceleration a
max
is estimated
with a local site analyses.
The CSR in the Eurocode is determined as following:
= 0,65 ∙
∙
∙
(2)
Neither charts nor relations are given for an estimation of S,
defined as a ‘soil parameter’. As equations 1 and 2 are similar, it
will be considered in the following parts that r
d
and S are equal.
3.2
Assessment of stress reduction ratio r
d
according Youd et
al. (2001)
Cited in the report of the NCEER and NSF/NCEER workshops
(Youd et al. 2001), the relationship proposed by Liao and
Whitmann (1986) is a linear approximation of the average
values from the Simplified Procedure by Seed and Idriss (1971),
see Figure 1, and can be used in routine practice and noncritical
projects:
= 1,0 − 0,00765 ∙
= 1,174 − 0,0267 ∙
for z
≤
9,15 m
for 9,15m < z
≤
23 m
(3)
where z is the depth below ground surface in meters. For an
easier handling of the software, Blake (1996) proposed the
following relation (Youd et al. 2001):
=
,,∙
,
,∙,∙
,
,,∙
,
,∙,∙
,
,∙
(4)
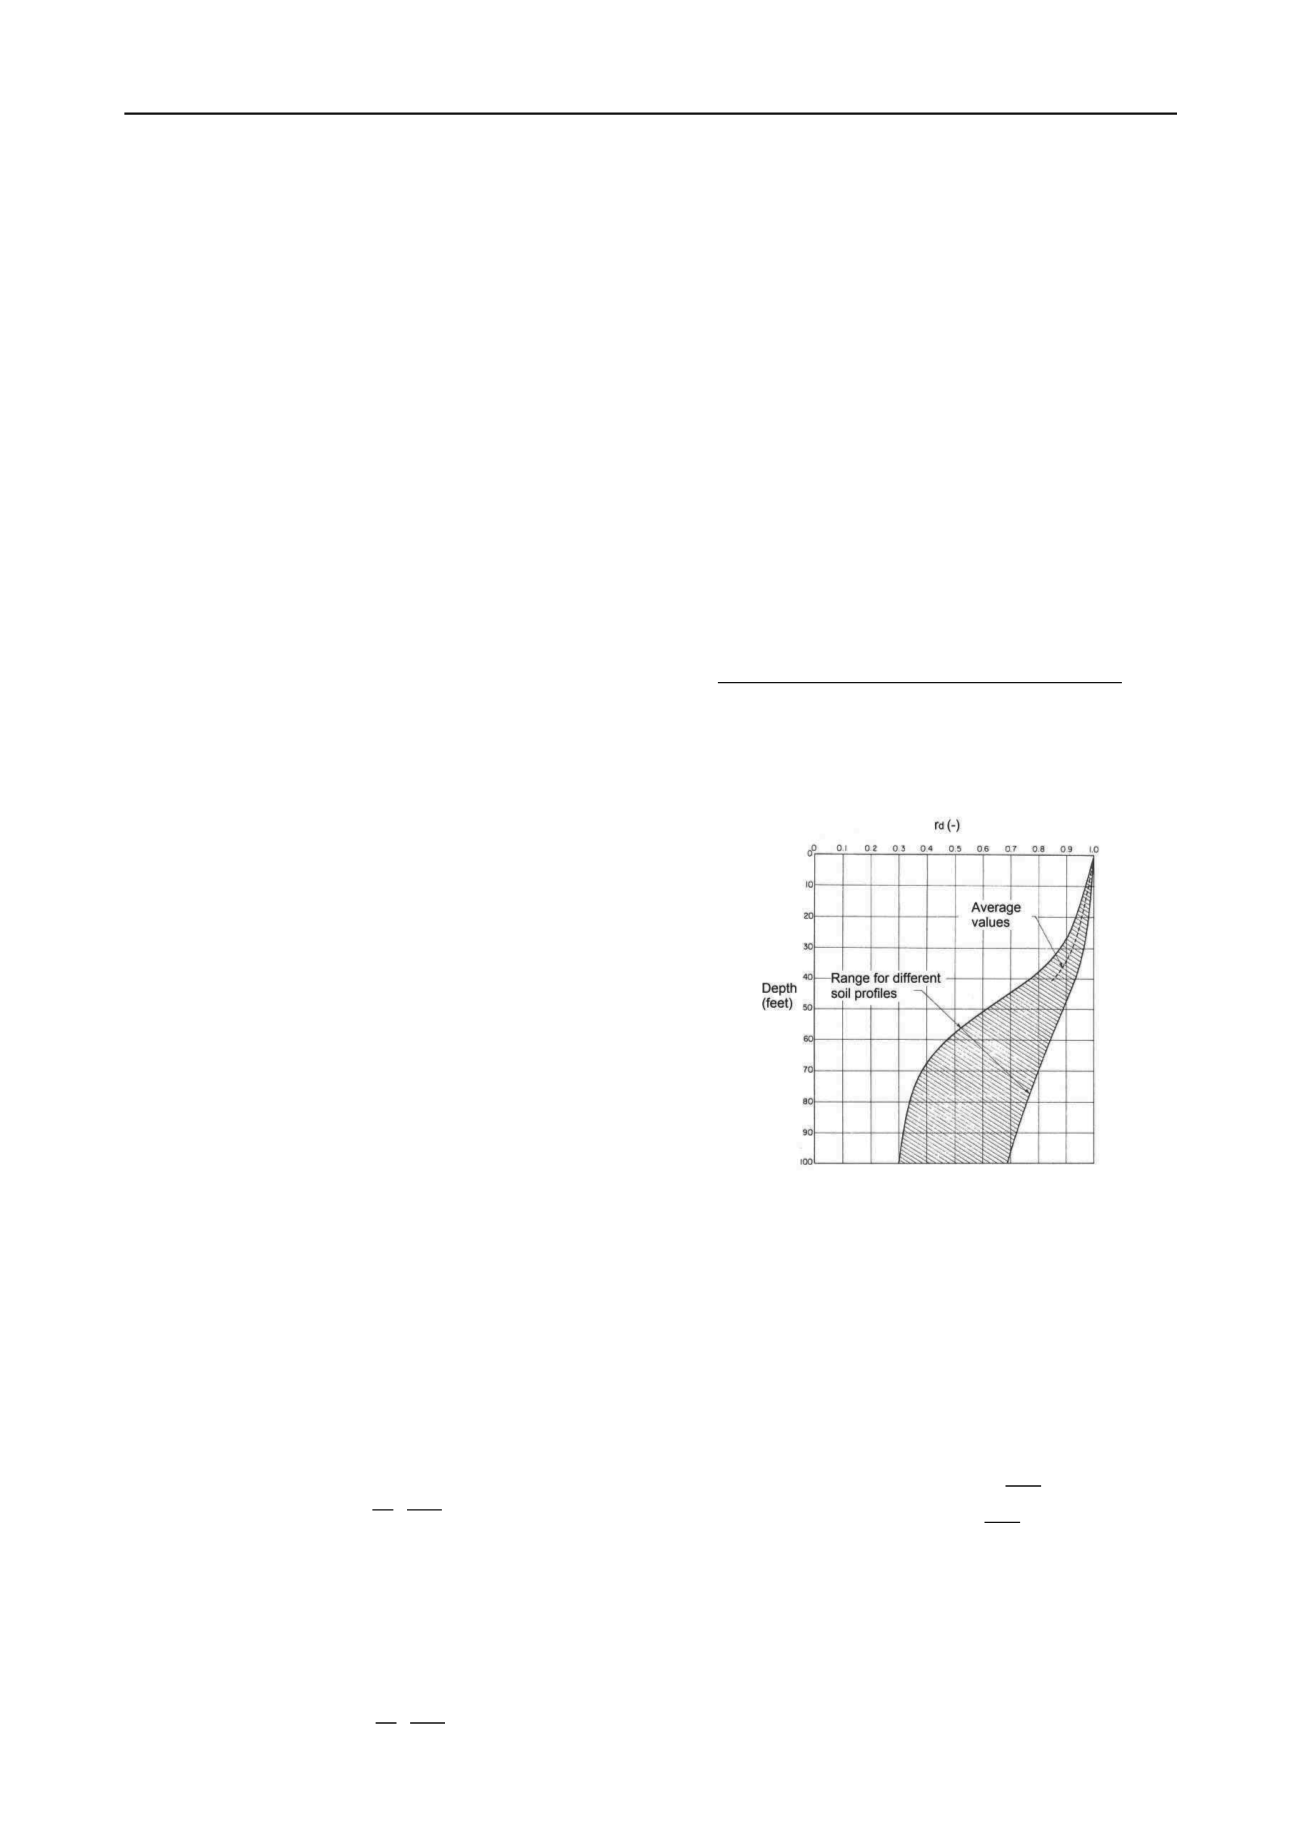
The obtained values of the stress reduction factor with those
equations are average values and it is notable that the range of
possible values increases with the depth, as illustrated in the
Figure 1.
Figure 1. r
d
values vs. depth curves developed by Seed and Idriss (1971)
3.3
Recently added methods (Cetin et al. 2004, Idriss and
Boulanger 2010)
During the last decade additional relations have been developed
in order to reduce the incertitude previously mentioned.
The procedure of Idriss (1999) considers the moment
magnitude M
w
in addition to the depth below ground surface z
(Idriss and Boulanger 2008, Idriss and Boulanger 2010):
= + ∙
with
= −1,012 − 1,126 ∙ sin
,
+ 5,133
and
= 0,106 − 0,118 ∙ sin
,
+ 5,142
(5)
According to Seed (2010), the criteria of the Simplified
Procedure and later of Idriss and Boulanger (2008) are not
enough conservative because of over-predicted r
d
-values. Seed
compares the relationships of Idriss and Boulanger (2008) with
those of Cetin et al. (2004). In that last procedure, a new
relationship is developed with a probabilistic approach, which
considers not only the depth and the magnitude scale but also


