1508
Proceedings of the 18
th
International Conference on Soil Mechanics and Geotechnical Engineering, Paris 2013
with other adverse factor such as low stability prior to blasting,
higher than normal ground water level due to high precipitation,
erosion at the slope base, temporary placement of fill masses,
etc. In addition, the existence of thin sand or silt layers within
the clay are confirmed in many cases, and are hence assumed to
have played a crucial role. In some cases the observed failures
have occurred some hours after the blasting indicating a
possible creep failure mechanism.
3 TRANSFER OF VIBRATIONS FROM ROCK TO SOIL
DEPOSIT
Data from rock blasting induced surface vibration in quick clay
deposits at a few locations in Norway have been analyzed (see
Figure 1). The blasting induced vibration amplitude (Peak
Particle Velocity) in the soil depends on a number of
parameters, such as the explosive charge size, distance from
blast location to the soil deposit, the geometry and material
properties of the rock and soil. There is considerable variability
in measured vibration amplitudes, sometimes horizontal
vibrations are larger and sometimes the vertical ones. The data
show the dominant frequencies of the soil vibration are between
15 and 35 Hz.
10
1
10
2
10
0
10
1
10
2
Distance normalized with 3rd root of charge size R/Q
1/3
[m/kg
1/3
]
Peak Particle Velocity [mm/s]
Vertical Peak Particle velocity vs. R / Q
1/3
Rock, Snekkestad, MPx
x
3
V
Clay near rock, Snekkestad MPx
x
4
V
Clay near rock, Snekkestad, MPx
x
7
V
Clay, Snekkestad, MPx
x
6
V
Rock, Kattmarka
Clay near rock, Kattmarka
Clay Kattmarka
Jorstadvann
Clay near rock
Clay
Rock
Figure 1 Vertical peak particle velocity vs. distance normalized with
third root of explosive charge size.
Numerical simulations have been performed to better
understand the transfer of vibration from rock into the clay.
Axi-symmetric models, with simplified geometries with rock on
the left and beneath a clay deposit, based on case histories have
been used as shown in Figure 2 . The ground vibration do not
depend very much on the slope of the soil surface, therefore all
models have horizontal surfaces. Velocity time histories from
the above field observations were used to calibrate the
numerical simulations to compute time histories of cyclic shear
strains and stresses at various locations within the clay deposit.
Focus has been on the relation between surface vibration
amplitude and shear strain in a homogeneous clay deposit to
study the effects of 1) Different stiffness within the clay and 2)
a thin layer with lower stiffness than the surrounding clay, and
3) different dip-angles of the rock-clay boundary.
Simulations show that there is a 2-3 m high by some 10 m
wide zone at the clay surface next to the rock-clay boundary
that is most affected by the blast vibrations.
Field vibration data and numerical results show the most
important factor of reduction of vibration amplitude is distance
attenuation, e.g. a reduction of almost one magnitude in
vibration amplitude at blast distances of 10 m and 50 m is
observed.
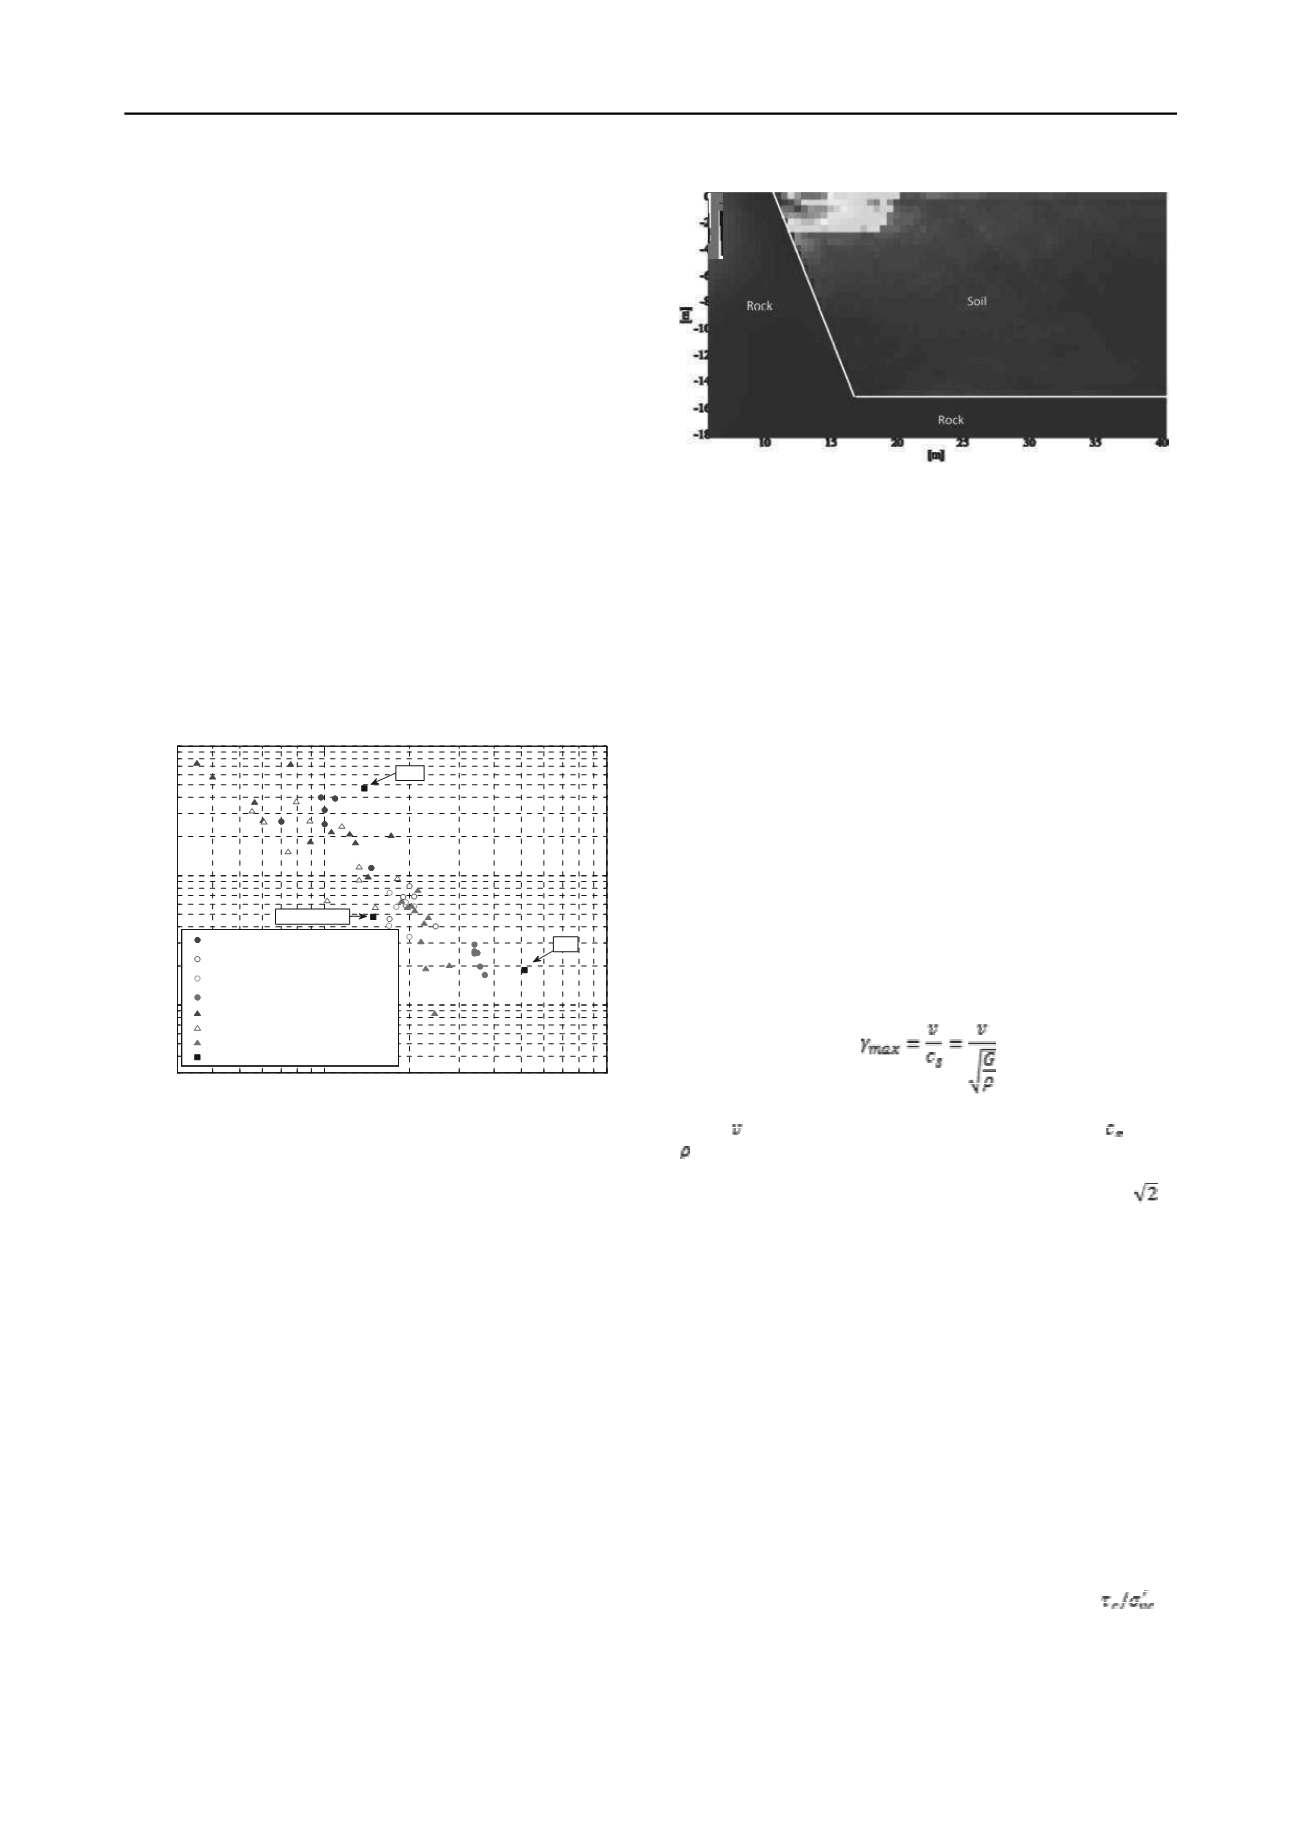
Figure 2 Maximum shear strain occurs in an area near the rock-clay
boundary. Explosion loading at upper 4 m of left side, marked with red
line.
The numerical analyses further show a doubling of vibration
amplitudes in a zone near the boundary between the rock and
soil. This amplification has however not been observed in the
field, one reason may be that the vibration sensor are not put
close enough to the rock-clay boundary. The vibrations decay
sharply from the location of the peak value. The simulations
show that the peak value is reduced to about 30% five meter
away from the location of the peak.
Results so far indicate larger amplification with lower dip-
angle of rock-clay boundary. The maximum cyclic shear strains
occur from the boundary between rock and clay to point at a
depth of about 1-2 m below the point at the surface where the
highest vibration amplitude are computed. This depth
corresponds to about half a wave length i.e. it depends on the
dynamic soil properties and vibration frequency.
The surface vibration amplitude turns out to be a good
indicator of the maximum shear strain the soil due to blast
operation. The numerical simulations confirm that the
maximum shear strain
max
, can be estimated with good
accuracy as
(1)
where is the peak particle velocity of the vibration, , G, and
are the soils shear wave velocity, shear modulus, and density
respectively. Equation (1) shows that if the shear modulus is
reduced to half, the shear strain increases with a factor of
for
the same vibration particle velocity at the surface. However,
also the particle velocity will depend on the modulus of the clay
for a given blast.
The numerical results so far show that within thin soft
layers the strain does not decay as quickly with distance as in a
homogenous clay deposit.
4 CONTOUR DIAGRAMS FOR CYCLIC AND CREEP
LOAD
There is a lot of knowledge about cyclic behaviour of clays,
however much less is so far known about quick clay subjected
to cyclic loading. Therefore two series of static and cyclic
laboratory tests were run on specimens from block samples
taken from representative quick clay deposits near Trondheim,
Norway. Index properties are given in Table 1.
The samples were consolidated with different ratios
between shear stress and vertical effective stress,
, in
order to simulate various slope angles.
The tests were run undrained by first applying stress
controlled cyclic loading to reach a specified permanent shear
strain, followed by creep to large shear strains. The initial shear
modulus, G
max
, was measured on all samples after
consolidation. The test results showed that the rate of creep was


