1500
Proceedings of the 18
th
International Conference on Soil Mechanics and Geotechnical Engineering, Paris 2013
Proceedings of the 18
th
International Conference on Soil Mechanics and Geotechnical Engineering, Paris 2013
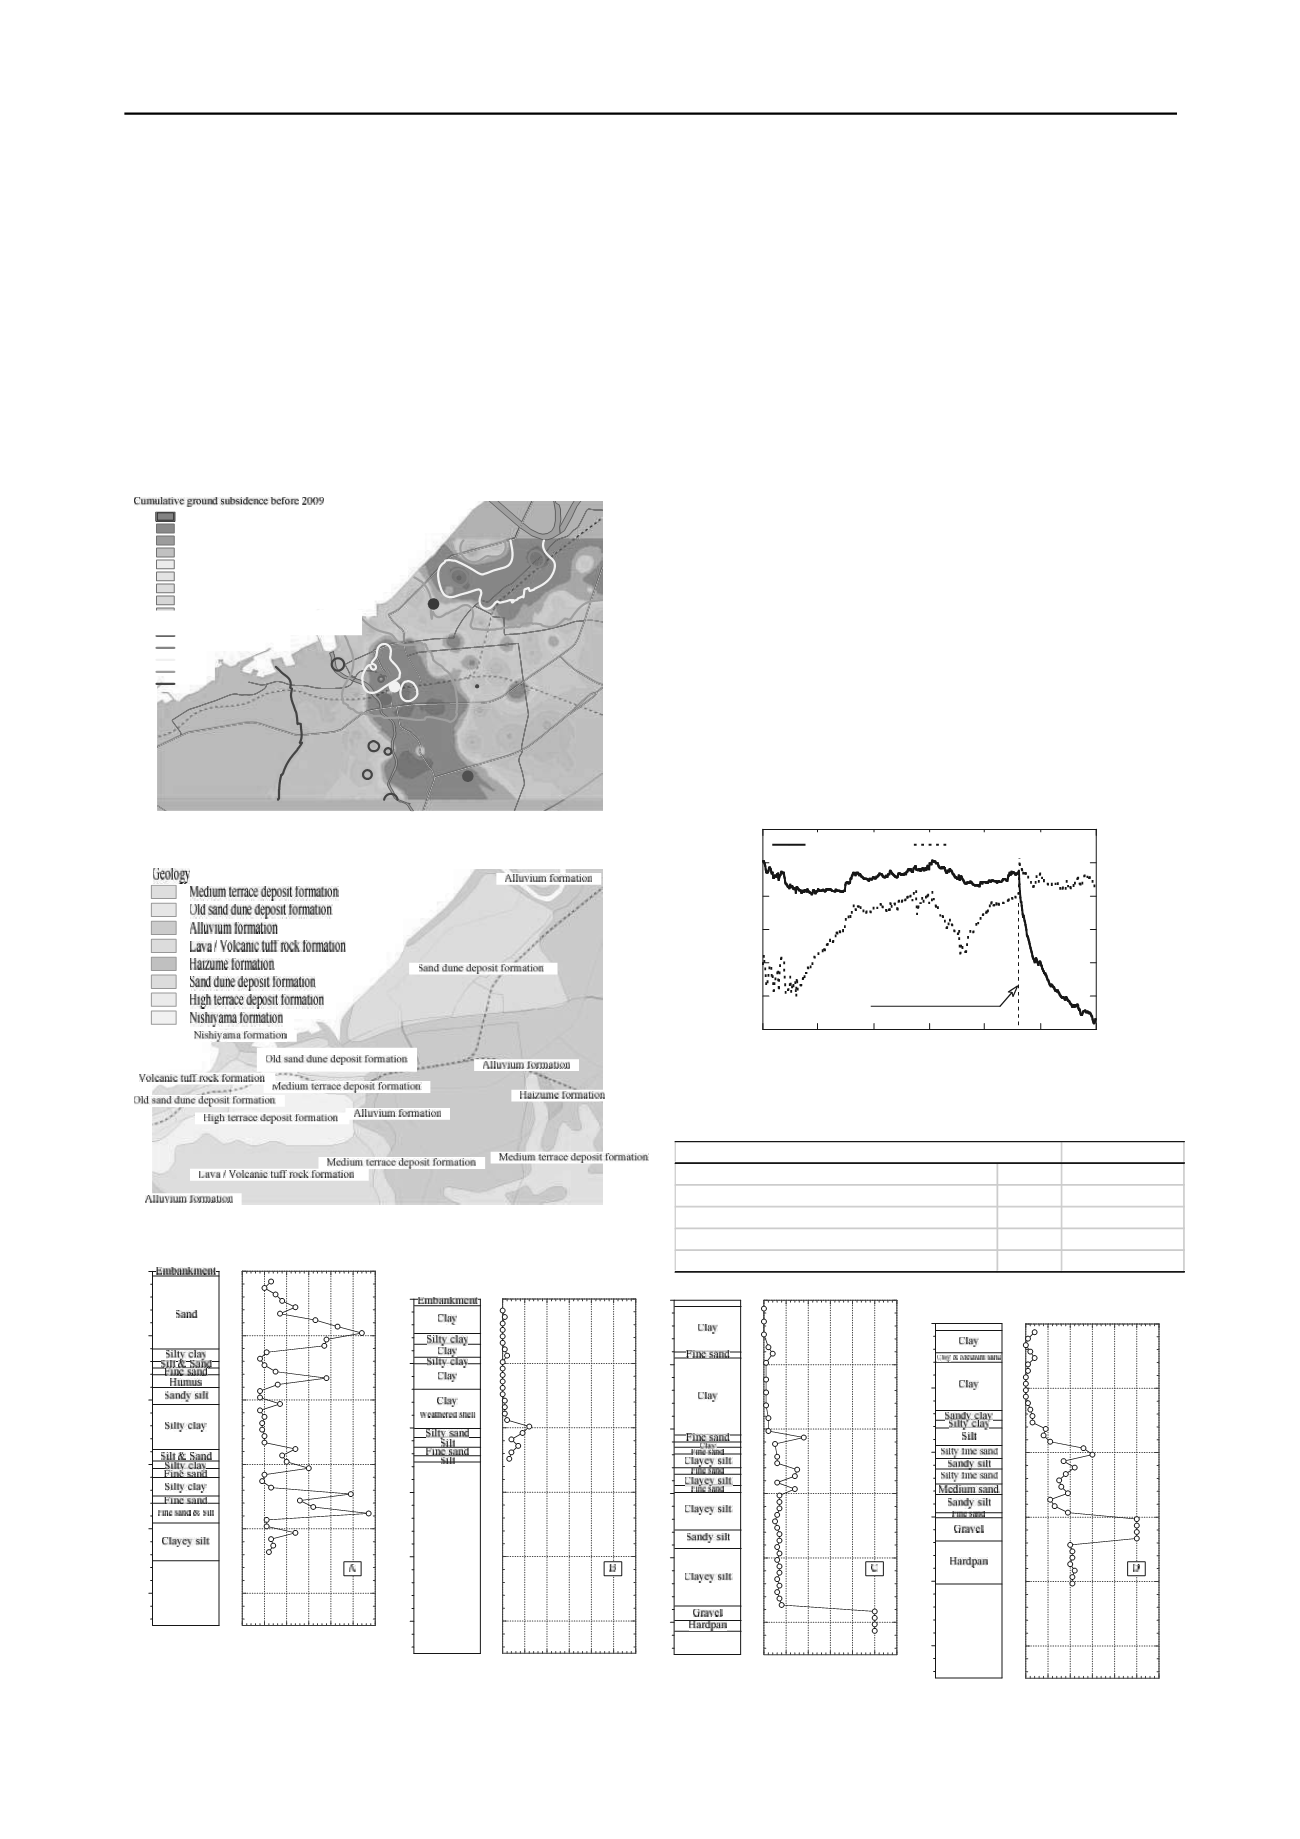
soft clay with N values ranging from 0 to 2. Small pieces of
weathered shells are seen from a depth of around 11.0 m, and
more significant shell presence is observed from around 14.0 m.
The soft clay layer extends to a depth of 21 m and sits on a silt
layer with an N value of approximately 10. The silt layer
extends to a depth of 50 m with N values of more than 50,
making it suitable as engineering foundation ground. In
contrast, the soft clay layer in the area around point D is thinner
than that around point C. Sand dunes with N values of more
than 10 cover the clay and slit layers at point A near the sea. It
is clear that the zone in which extensive post-quake subsidence
was observed corresponds to the area of the thick alluvial cl ay
layer.
Figure 1. (a) Cumulative ground subsidence before 2009 and in
Kashiwazaki City.
Figure 1. (b) Kashiwazaki City terrain classification.
3 SOFT CLAY SAMPLE PHYSICAL PROPERTIES AND
MECHANICAL CHARACTERISTICS
As there is a difference in the amount of contamination by
weathered shells between the shallow and deep clay layers,
intact samples were obtained from depths of G.L. -16.7 - 19.0 m
and G.L. -9.0 m - 11.7 m in the Shinbashi district of
Kashiwazaki City. The physical properties are shown in Tables
1. It can be seen that samples from both depths have a high
natural water content and plasticity index, and consist of more
than 50% clay.
Subsequently, oedometer tests and static and repeated CU
tri-axial tests were carried out to clarify the consolidation
characteristics of the samples from both depths. Two specimens
types were created: (1) intact specimens, and (2) reconstituted
specimens made from a slurry sample with water added after the
above tests. To achieve a high degree of saturation, vacuum
conditions were applied to both the cell and the sample interior.
The specimen was isotropically consolidated for 18 hours under
confining pressures of 50 - 200 kPa. In order to examine static
shear strength and liquefaction strength, static and cyclic tests
were performed by applying deviator stress at a loading rate of
0.021 mm/min and uniform sinusoidal cycles of deviator stress
at a frequency of 0.01 Hz with a varying cyclic stress ratio
under constant cell pressure.
Figure 2. Temporal changes in ground water level and
cumulative subsidence to a d epth of 23 m (from 2006 to 2008).
Table 1. Kashiwazaki clay physical properties.
鯨波
半田
横山
番神
春日
中浜
枇杷島
新赤坂
安政町
岩上
松波
米山台
栄町
剣野町
田中
枇杷島
城東
松美
四谷
比角
西本町
北園町
扇町
北半田
宝町
北斗町
寿町
赤坂町
東本町
桜木町
駅前
学校町
関町
緑町
大久保
新橋
豊町
下方
藤元町
常盤台
幸町
南半田
ゆりが丘
茨目
西港町
天神町
鏡町
朝日が丘
東の輪町
宮場町
長峰町
錦町
三和町
槇原町
日吉町
元城町
穂波町
柳橋町
南光町
長浜町
日石町
田塚
東港町
小倉町
若葉町
新花町
軽井川
柳田町
諏訪町
東長浜町
大和町
希望が丘
中央町
三島町
新田畑
米山台東
小金町
枇杷島
向陽町
半田
橋場町
劔野
東柳田
米山台西
城塚
佐藤池新田
劔野
劔野
佐藤池新田
三島西
R8
R352
R353
R252
R8
柏
崎
港
線
野田・西本線
黒部・柏崎線
東柏崎停車場線
黒部
・
柏
崎
線
柏
崎
停
車場
線
H21年累計沈下量(mm)
-200
-100
-50
-40
-30
-20
-10
0
10
H19-21年沈下量(mm)
-40
-30
-20
-10
0
沖積層
砂丘堆積層
溶岩・火砕岩など
高位段丘堆積層
中位段丘堆積層
古砂丘堆積層
古砂丘堆積層
沖積層
砂丘堆積層
溶岩・火砕岩など
中位段丘堆積層
灰爪層
中位段丘堆積層
砂丘堆積層
沖積層
沖積層
西山層
信越本線
越後線
R8
R352
R353
R252
R8
柏
崎
港
線
野田・西本線
黒部・柏崎線
東柏崎停車場線
東
柏
崎
停車
場
・
比角
線
黒
部
・
柏
崎
線
黒
部
・
柏
崎線
柏崎停車場線
地質
中位段丘堆積層
古砂丘堆積層
沖積層
溶岩・火砕岩など
灰爪層
砂丘堆積層
西山層
高位段丘堆積層
-5.0
0.0
5.0
10
15
20
25
-50
0
50
100
150
200
250
2006/1 2006/5 2006/9 2007/1 2007/5 2007/9 2008/1
Total subsidence
Ground water level
Cumulated subsidence [mm]
Ground water level [cm]
Chuetsu-Oki earthquake
Clay
Specific gravity [g/cm
3
]
G
s
2.68
Plasticity index[%]
I
p
48.6
Liquid limit [%]
w
l
87.0
Plastic limit [%]
w
p
38.4
Natral water content [%]
w
n
73.5
A
B
C
D
0
10
20
30
40
50
0 10 20 30 40 50 60
SPT N-value
0
10
20
30
40
50
0
10
20
30
40
50
0 10 20 30 40 50 60
SPT N-value
0
10
20
30
40
50
0
10
20
30
40
50
0 10 20 30 40 50 60
SPT N-value
0
10
20
30
40
50
0
10
20
30
40
50
0 10 20 30 40 50 60
SPT N-value
0
10
20
30
40
50
Figure 3. Geological columns for Kashiwazaki City based on boring investigation carried out by the authors and information from
the Hokuriku Geological System database (A
–
D correspond to the areas on the map shown in Figure 1 (a)).
Cumulative ground subsidence after the earthquake


