1226
Proceedings of the 18
th
International Conference on Soil Mechanics and Geotechnical Engineering, Paris 2013
lumped mass, which hits the impact foot after a free fall. The
initial velocity of the impact foot, which excites the
underground, was derived assuming an idealized elastic impact
between falling weight and the mass of the impact foot. The soil
medium was modeled as homogenous, isotropic, and rate-
independent elastoplastic halfspace based on Mohr-Coulomb
theory with isotropic hardening. The axially symmetric impact
foot made of steel rests on the surface of the halfspace. A
sliding interface between the foot and the soil was adopted, i.e.
only normal stresses are transferred between the foot and the
soil. The numerical model takes advantage of the rotational
symmetry of this subsystem, which is divided into a near-field
and a far-field. The near-field was discretized by means of
Finite Elements. Infinite Elements model the far-field in order
to avoid wave reflections at the boundary between the near- and
far-field, and to allow for energy propagation into the semi-
infinite halfspace. The model and its parameters are described in
more detail in Adam et al. (2010).
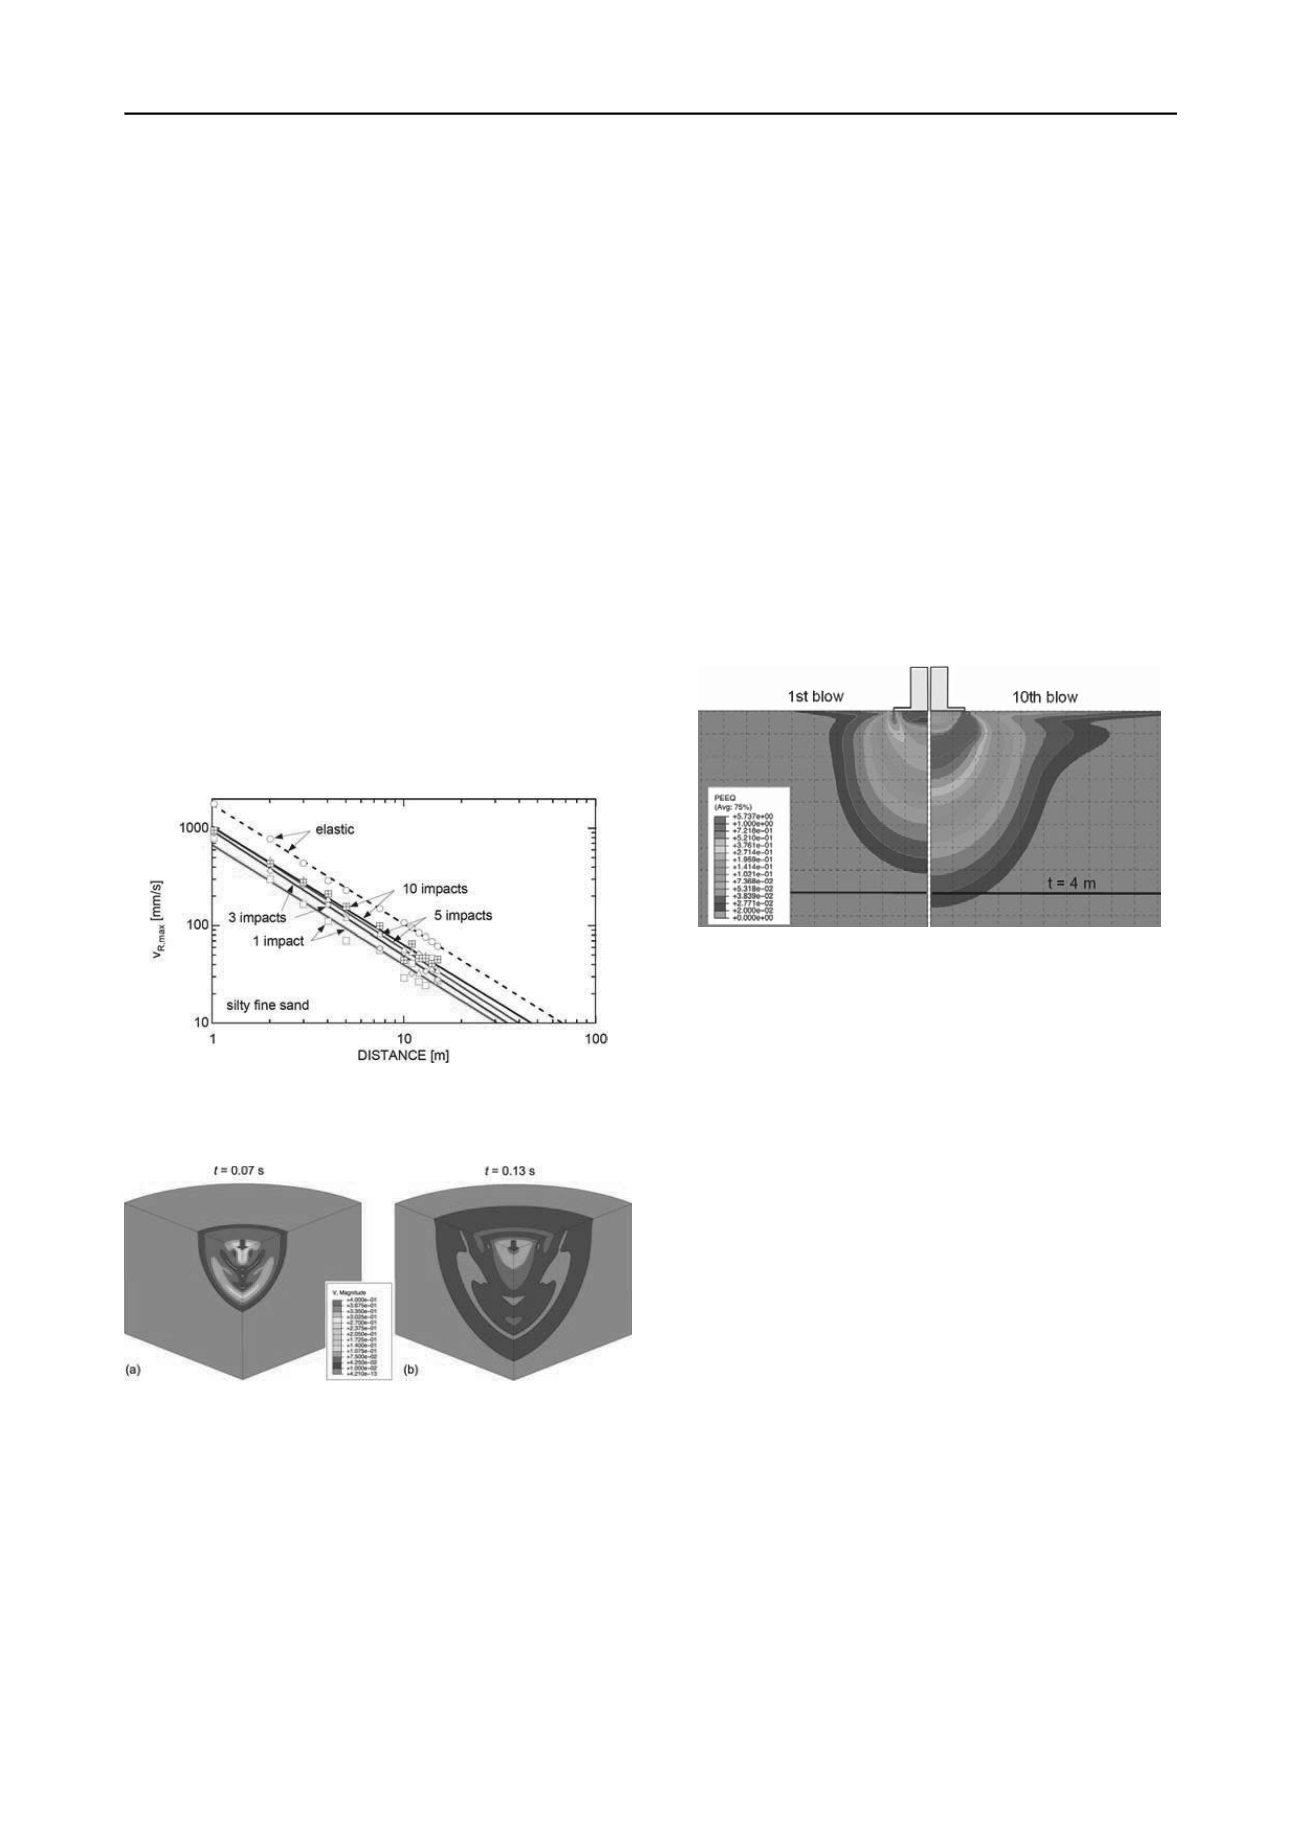
As an example, Figure 1 shows the peak velocity magnitude
v
R,max
with respect to the distance of the compaction point for
the subsoil condition silty fine sand after the first, third, fifth,
and tenth compaction pass. The outcomes of this figure prove
field observations that the pronounced increase of v
R,max
after
each compaction impact leads to a parallel shift of the
regression line, and thus, the arbitrary assumed limit value of
10 mm/s is shifted to a larger distance from the compaction
point.
Figure 1. Magnitude of maximum resultant surface velocity as function
of the distance from the impact foot after a specified number of
compaction impacts applied to an elastoplastic silty fine sand.
Figure 2. Distribution of the velocity magnitude at two specified
instants after the first compaction impact. Elastoplastic silty fine sand.
Figure 2 shows the propagation of the velocity magnitude at
two instants after the first impact is applied to the subsoil
condition silty fine sand. Spherical propagation of the waves
can be observed. Comparison of Figure 15(a) and Figure 15(b)
prove that geometric damping leads to a rapid decay of the
response amplitudes. According to Figure 15(b) the maximum
peak velocities develop at the soil surface, because Rayleigh
waves have the largest energy content. Furthermore, the faster
propagating P-waves can be distinguished from the slower S-
waves. According to the characteristics of P-waves in zones
between compression and dilatation the velocities are zero.
The effect of compaction and the compaction depth have
been investigated, because these properties serve to define the
application fields of the Impact Compactor with respect to soil
type and soil stratification. In numerical studies it was assumed
that the equivalent plastic strain is the characteristic parameter
for evaluation of the compaction depth. A threshold of 0.02
separates the compacted space from the non-compacted subsoil.
After each impact in the compaction zone the soil properties
were modified. Here, an isotropic hardening constitutive model
was used for an engineering-like approximation of soil
compaction.
Figure 3 shows the expansion of the equivalent plastic
strains in a cross-section of homogeneous silty fine sand below
the impact point after the first and tenth compaction pass. The
colored area within the outer contour is considered as
compaction zone. The largest equivalent plastic strains occur
below the boundary of the compaction foot. The domains of
equal plastic strains, i.e. the domains of equal degree of
compaction, show the shape of a “stress bubble”. It can be seen
that in this example the soil is compacted laterally and
downwards with approximately the same magnitude. A thin
surface layer shows as well distinct equivalent plastic strains,
which are induced by Rayleigh waves. After the tenth impact
the compaction depth is about 4.3 m.
Figure 3. Spread of the equivalent plastic strain after the first (left) and
after tenth compaction impact (right). Elastoplastic silty fine sand.
2.2
Field experiments
Field tests on different soil conditions were performed to verify
theoretically derived outcomes. Moreover, they provide the
basis for the optimized and economic application of this
compaction method in the field.
Experimental results and field investigations confirm the
trends of the presented numerical outcomes (see chapter 3).
3 DEVELOPMENT AND APPLICATION
3.1
GPS-based recording system
The Impact Compactors are provided with a monitoring system.
The compaction monitor is a kit of parts, which can be coupled
to the compaction device in order to record the performance of
the hammer and the rate of ground improvement. The following
parameters are automatically recorded during the compaction
process and monitored from the cab with an on-board data
acquisition system (see Figure 4):
number of blows
final settlement at the last blow
total settlement (depth of the compaction crater)
compaction energy
average number of blows
In addition to these parameters a more novel device monitors
electronically the coordinates of the compaction points, date,
and time for each compaction point during the compaction
process, and all data are documented via GPS controlled data
acquisition (see Figure 4).
GPS-based data recording during the compaction process
and the online display in the operator’s cab facilitates
compaction control, an economic application of the compaction


