1218
Proceedings of the 18
th
International Conference on Soil Mechanics and Geotechnical Engineering, Paris 2013
Chirica et al. (2013) presented the analysis of a road
embankment with variable height located at Iassy (Romania).
The FEM model had taken into account various hypotheses: (1)
modeling the soil in natural state, (2) modeling the foundation
in flooded state, and (3) modelling the foundation soil in a
flooded state and with different imposed consolidation
conditions. They reported that out of all the test hypotheses, the
flooded state exhibited the highest strain and lowest bearing
capacity.
Jacobse et al. (2013) developed a 3D FEM model to capture
the deformation of new lifting bridge constructed across the
river Oude Maas in the Rotterdam Harbour. They applied a
simplified stochastic subsoil model to quantify the risk in order
to deal with the uncertainty. They highlighted that the
distribution of expected rotation is more or less equal to zero
(Figure 16) and was in agreement with the deterministic
settlement calculations.
Figure 16. Results Monte Carlo analysis pier 40, residual rotations
(source: Fig 4, Jacobse et al. 2013).
1.2
Discrete element modelling (DEM)
The use of Distinct Element Method (DEM) in transport
geotechnics is gaining popularity, but regrettably there is no
significant contribution made in this theme at this Conference.
Therefore, for completeness of this General Report, a succinct
description is provided herewith. Ballast layer is often subjected
to large dynamic stresses (Yang et al. 2009), which contribute to
track settlement caused by particle breakage and densification,
leading to frequent maintenance (e.g. McDowell and Harireche
2002, Lobo-Guerrero and Vallejo 2006, Indraratna et al. 2010,
Indraratna et al. 2012).
McDowell and Harireche (2002), and Indraratna et al. (2010)
considered each particle as an agglomerate of several bonded
particles. Disintegration of this agglomerate during loading is
considered as breakage (Figure 17). Lobo-Guerrero and Vallejo
(2006) simulated particle breakage by replacing the original
particles with an equivalent set of smaller particles, when the
original particle satisfies a predefined failure criterion.
Figure 17. Final fracture of a typical 0.5 mm diameter agglomerate
showing intact contact bonds (after McDowell and Harireche 2002).
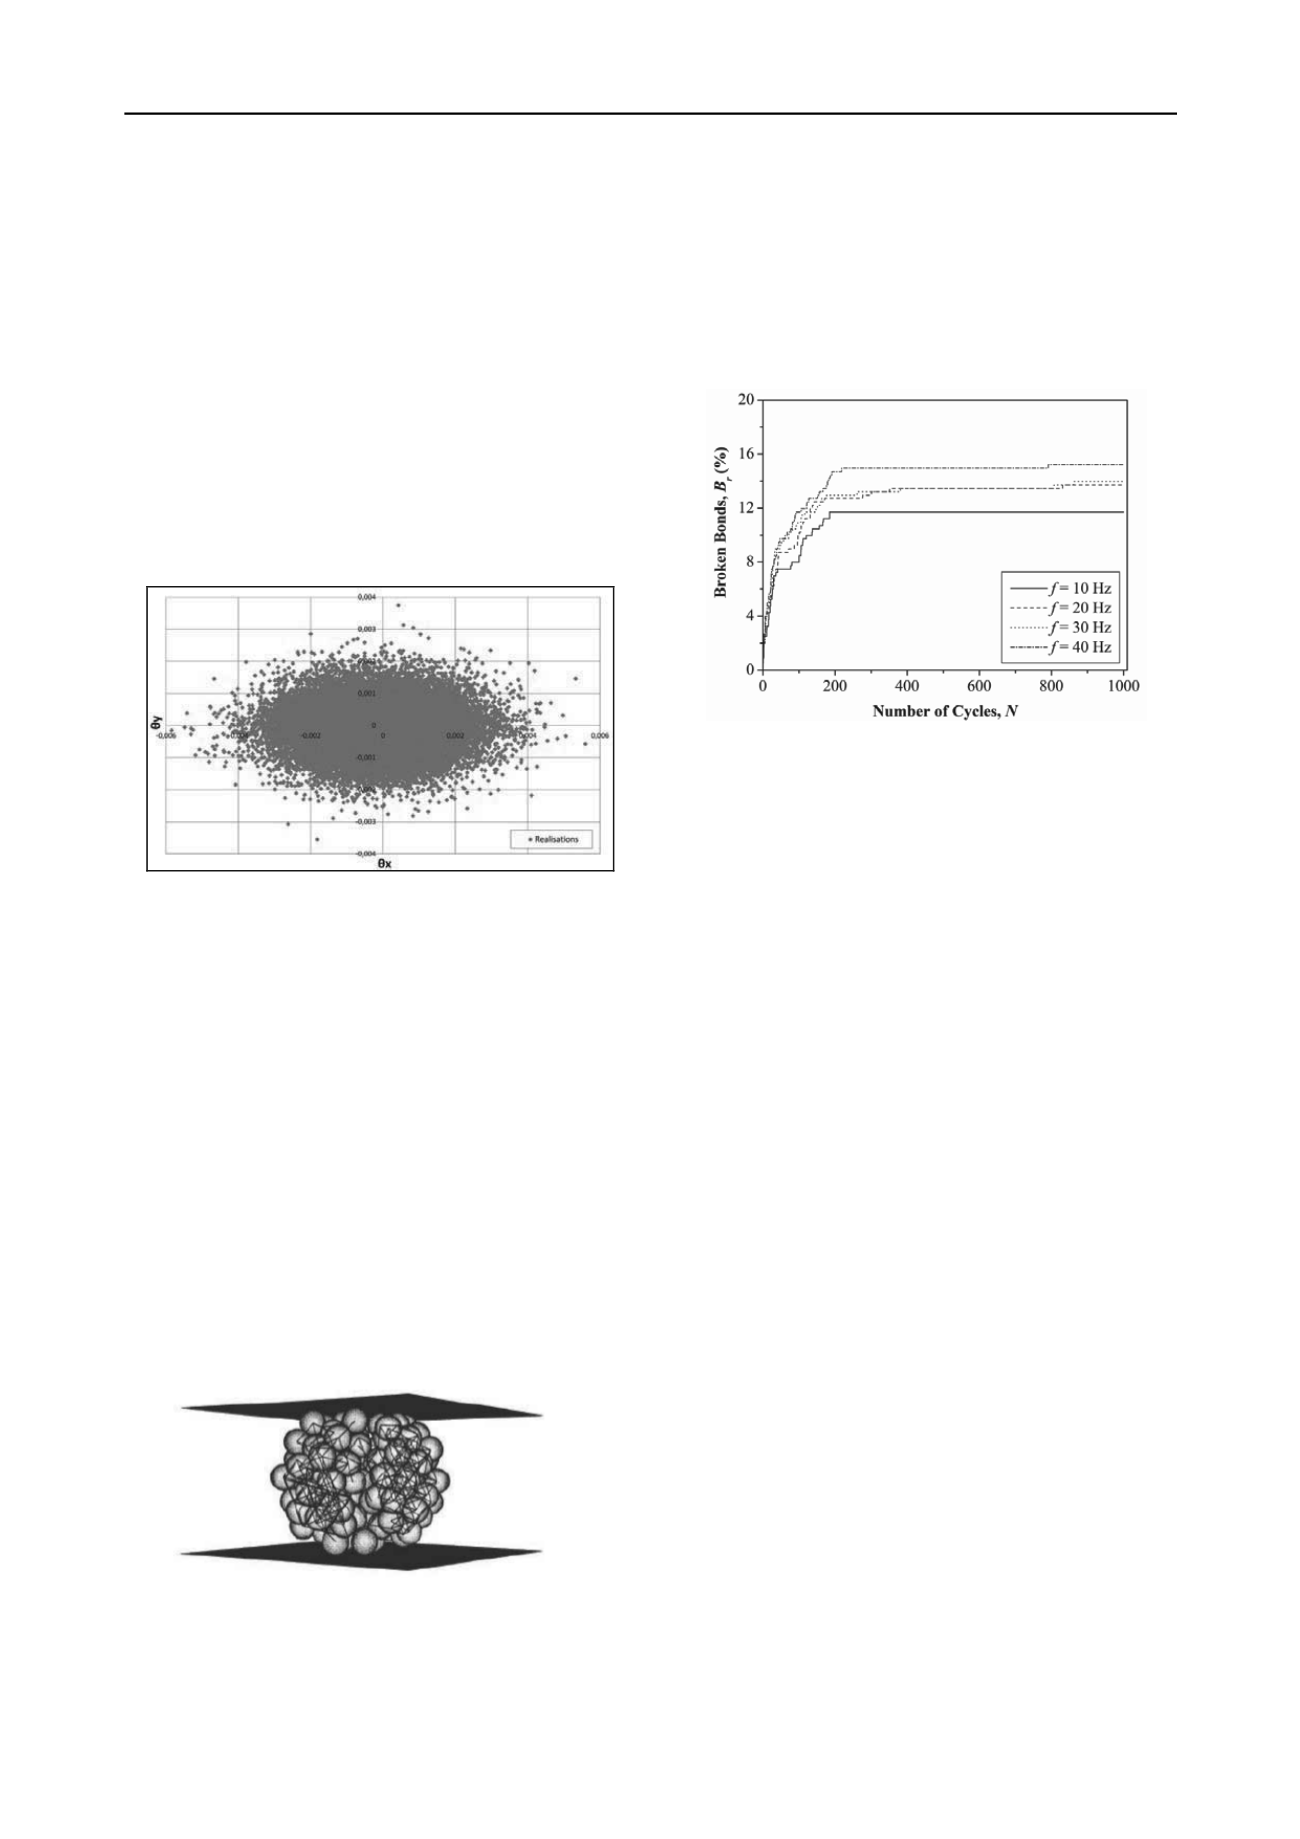
Indraratna et al. (2010) developed a DEM (PFC
2D
) model to
capture the influence of frequency on the deformation and
degradation of ballast during cyclic loading. DEM simulations
were performed at frequencies of 10 Hz, 20 Hz, 30 Hz, and 40
Hz and for low values of loading cycles (N < 1000). The
cumulative bond breakage (B
r
), defined as a percentage of
bonds broken compared to the total number of bonds is shown
at different f and N (Fig. 18). It is observed that B
r
increases
with the increase in f and N. Most of the bond breakages
occurred during the initial cycles of loading, causing rapid
permanent deformation at the start of loading, as this is exactly
what is observed on new tracks upon the passage of initial
trains.
Figure 18. Effects of frequency (f) on bond breakage (B
r
) with number
of cycles (N) (after Indraratna et al. 2010).
Huang and Tutumluer (2011) assessed the behavior of fouled
ballast using a “half-track” 2D DEM model. They studied the
effects of different percentages of fouling and the corresponding
and locations on track settlement. Recently, Indraratna et al.
(2012) employed a 3D DEM model to study the shear behaviour
of fresh and coal fouled ballast in direct shear testing. Fouled
ballast with void contaminant index (VCI) ranging from 20% to
70% was modeled by injecting a specified number of miniature
spherical particles into the ballast voids. The micro-mechanical
observations obtained through DEM studies imply that fouling
decreases particle breakage due to diminished stress
concentrations or contact forces between ballast grains, but
considerably impedes drainage when the VCI > 40%.
2 FIELD PERFORMANCE EVALUATION
There are 6 papers that have been included in this section. Two
papers discuss the results of monitoring of full scale
embankments used for ground improvement (Boutonnier et al.
2013, Buggy 2013) while one paper focuses upon the stability
and settlement analysis of the road embankment (Murjanto et al.
2013). Effects of moisture, mechanical indices and asphalt
reinforcement on the performance of concrete pavements are
presented (Teltayev 2013, Touole and Thesseling 2013).
Laboratory studies as well as field studies are conducted to
evaluate the performance of shale as fill and embankment
material (Solomon et al. 2013).
Boutonnier et al. (2013) describe the monitoring of six full-
scale embankments to measure settlements and the time of
consolidation. They estimate the preconsolidation pressure
using undrained cohesion C
u
and consider the coefficient of
consolidation C
v
as ten times the laboratory measured C
v
value.
They further conclude that the calculated settlements and time
of consolidation are in good agreement with the measurements.
Buggy (2013) describes the observational approach used to
control embankment stability primarily by means of monitoring
filling rates, pore pressures and deformation ratio (ratio of
lateral toe displacement to vertical crest settlement).
Embankments up to 10 m height are constructed in multiple
stages with continuous monitoring of performance by means of
piezometers, inclinometers, settlement plates and survey
monuments. A combination of prefabricated vertical drain


