1214
Proceedings of the 18
th
International Conference on Soil Mechanics and Geotechnical Engineering, Paris 2013
aggregates (Fonseca et al. 2013) applied to transport
infrastructure are also presented and discussed.
Adam et al. (2013) introduced a finite element modeling
framework for analyzing the performance and efficiency of an
impact compactor in relation to the surface velocity, weight of
impact compactor and number of passes. Field observations
indicate that the impact compactor is suitable for treating a wide
variety of loose soils and fills, but the effective treatment depth
is dictated by the grain size, typically ranging from 4.5m to 10m
depth. Experience of two case studies suggests that Dynamic
Probing Tests (Figure 1) are adequate for evaluating the
efficiency of compaction.
depth [m]
4.5 m
12.0 m
4.0 m
gravel
core
(loess / loam)
compacted zone
N
10
BEFORE RIC
AFTER
RIC
Figure 1. Test dike and correspondent dynamic probing test results.
(Source: Fig 8, Adam et al. 2013).
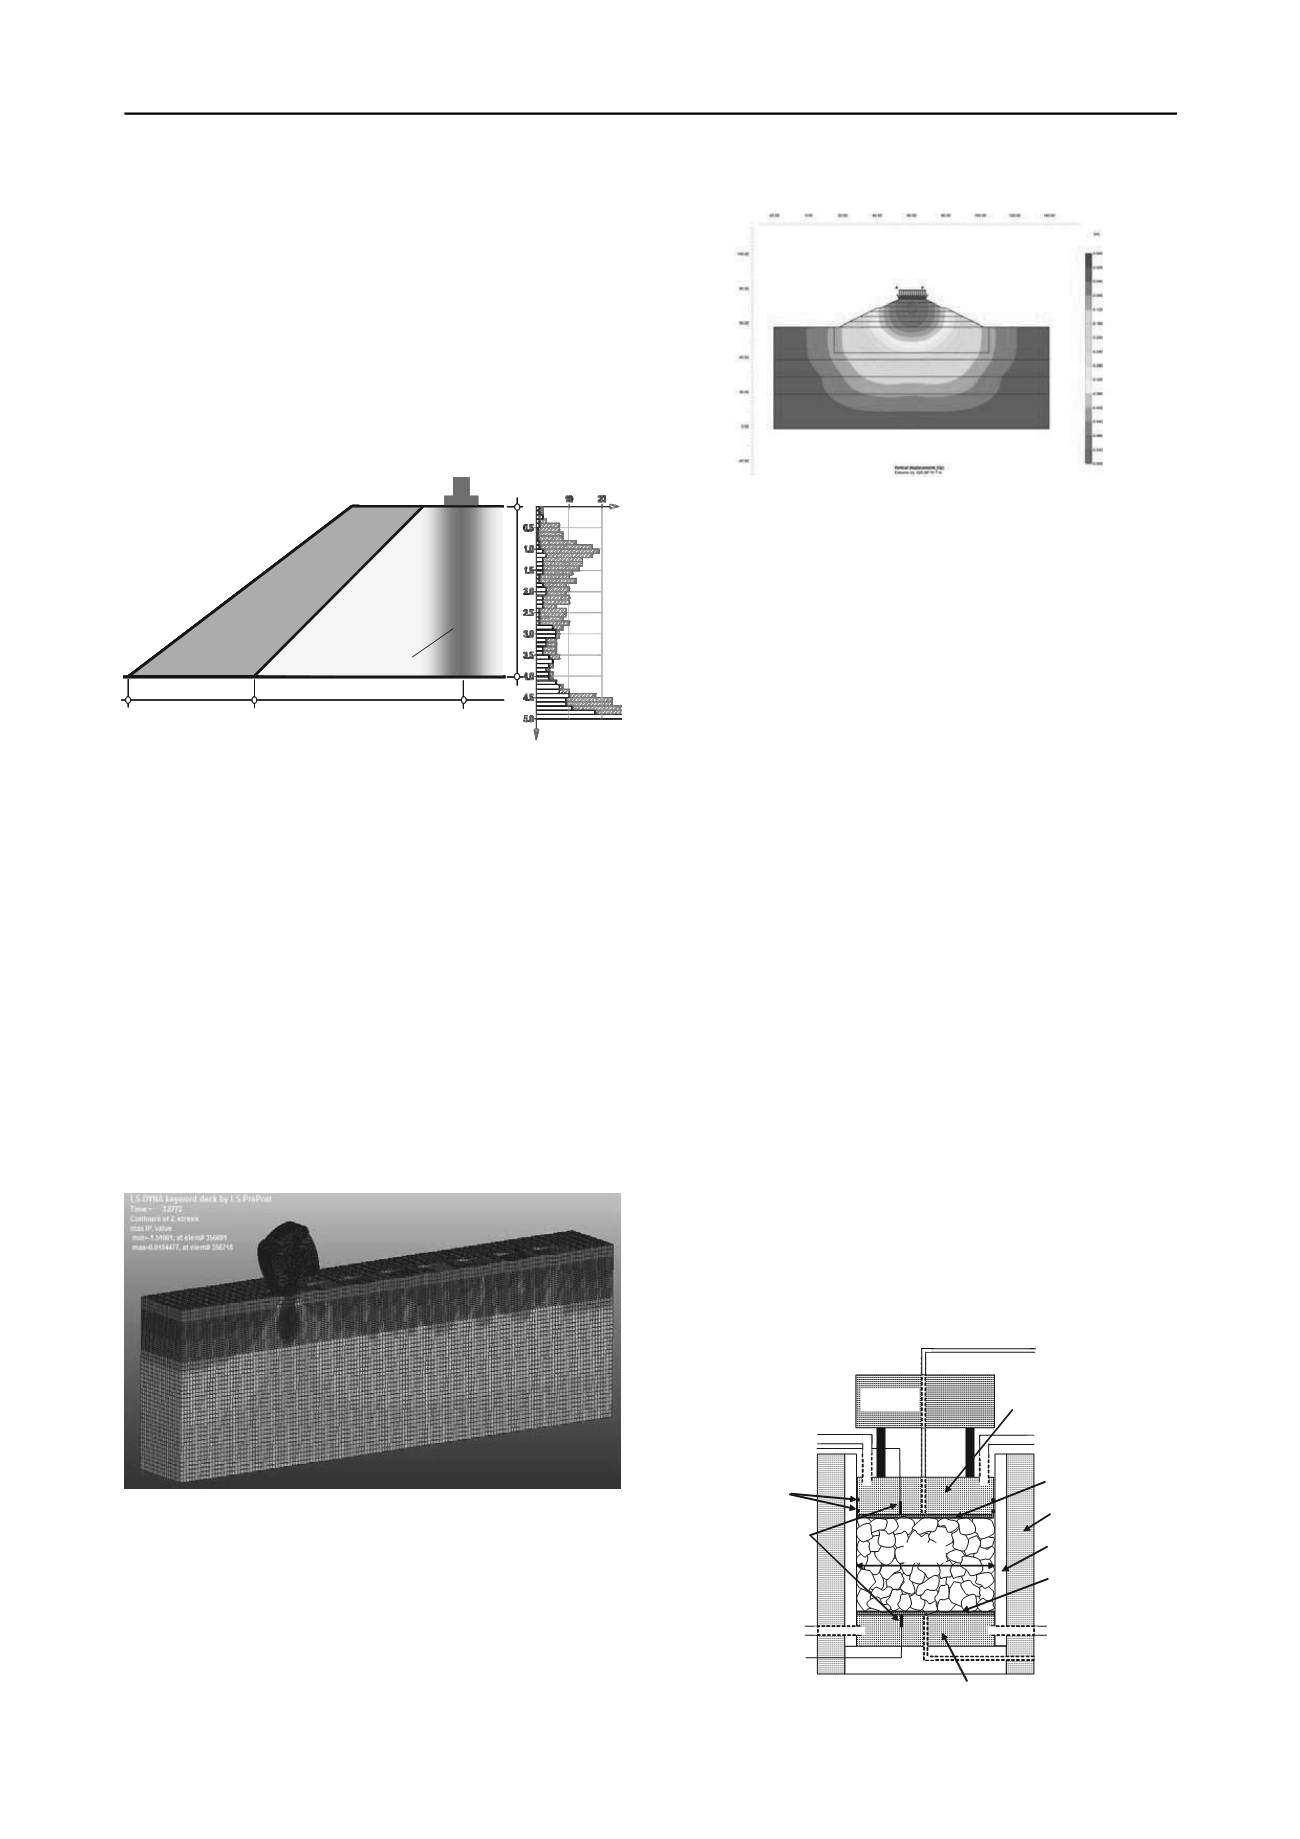
Kuo et al. (2013) have described the effectiveness of Rolling
Dynamic Compaction (RDC) by the combination of field
studies with numerical modeling (Figure 2). At the ground
surface, there are noticeable large deformations, and RDC
proves to be most effective between the depths of 0.8m and
3.0m. The preliminary parametric study showed that most
significant factors were soil cohesion, Poisson’s ratio and shear
modulus, as well as the width and mass of the RDC module.
An interesting study on the feasibility of a stiffness-based
specification for embankment soil compaction quality control is
discussed by Conde et al. (2013). An array of instruments are
adopted for compaction control, which measures soil stiffness
and then discussed on the basis of an earth dam construction.
Among the different equipment used, the DCP (dynamic cone
penetrometer) equipment showed greater promise as a
compaction control tool, partly attributed to the strong negative
correlation with water content values.
Figure 2. FEM model (Source: Fig 3, Kuo et al. 2013).
Kirstein et al. (2013) have described the application of a
combination of ground improvement techniques to stabilize a
recently placed brown coal landfill embankment for supporting
a new road. Owing to significant stability problems and the
small settlement tolerance of the structure (15 m deep),
“floating” stone columns were also installed. The design and the
associated settlements were significantly influenced by the
combination of different soil improvement techniques. The
settlement predictions were obtained using a finite element
model (Figure 3) and successfully verified against the results of
pressuremeter tests.
Figure 3. Representation of the predicted total settlements obtained with
Plaxis (Source Fig 10, Kirstein et al. 2013).
Fonseca et al. (2013) presented some intriguing results
obtained through laboratory studies performed on compacted
mixtures of cement and limestone aggregates. The results
indicated that the differences observed in dynamic and static
stiffness properties and shear strength parameters were directly
associated with the variation of porosity/cement ratio. As
expected, a higher stiffness and strength were obtained by
increasing the cement content and the degree of compaction.
While a hardening soil model could be employed to adequately
describe the observed stress-strain behaviour, the volumetric
predictions and the post-peak strain softening response could
not be reproduced satisfactorily.
3 LABORATORY TESTING
This section includes 6 articles. Two papers demonstrate the
results of California Bearing Ratio (CBR) tests performed on
the subbase (Ishikawa et al. 2013) and the subgrade (Moayed et
al. 2013). Some studies focus on cyclic loading tests on ballast
(Kumara and Hayano 2013) and subgrade (Mohanty and
Chandra 2013), while the others investigate the overall
performance of railway track (Calon et al. 2013, Hayano et al.
2013).
Ishikawa et al. (2013) examined the effects of freeze-thaw
and water content on the deformation-strength properties of
granular base materials. Two types of tests are conducted on
these materials under various water contents. One test is based
on the newly developed CBR equipment (Figure 4), and the
other using medium-size triaxial apparatus. The freeze-thaw of
granular base showed a strong influence on the fatigue life of
pavement structures. When number of freeze-thaw process
cycles increased, CBR values decreased regardless of the water
content. Resilient modulus showed a decreasing tendency with
the increasing water content.
150
Surcha
rge
Water supply
/ drainage
Coolant
circulating line
Insulation
Acrylic cell
Base cooling plate
Temperature
sensor (pt100)
Porous metal
with filter paper
O-ring
Water supply
/ drainage
Porous metal
with filter paper
Top cooling plate
Coolant
circulating line
Coolant
circulating line
Coolant
circulating line
Figure 4. Freeze-thawing CBR test apparatus. (Source: Fig 1, Ishikawa
et al. 2013).


