3436
Proceedings of the 18
th
International Conference on Soil Mechanics and Geotechnical Engineering, Paris 2013
there is significant similarity between SOSM and MCS
methods, while the FOSM method underestimates the results
due to the non-consideration of the high orders terms in
Taylor’s series. The contribution to the knowing of the
uncertainties in settlement predictions can provides a more
safety design.
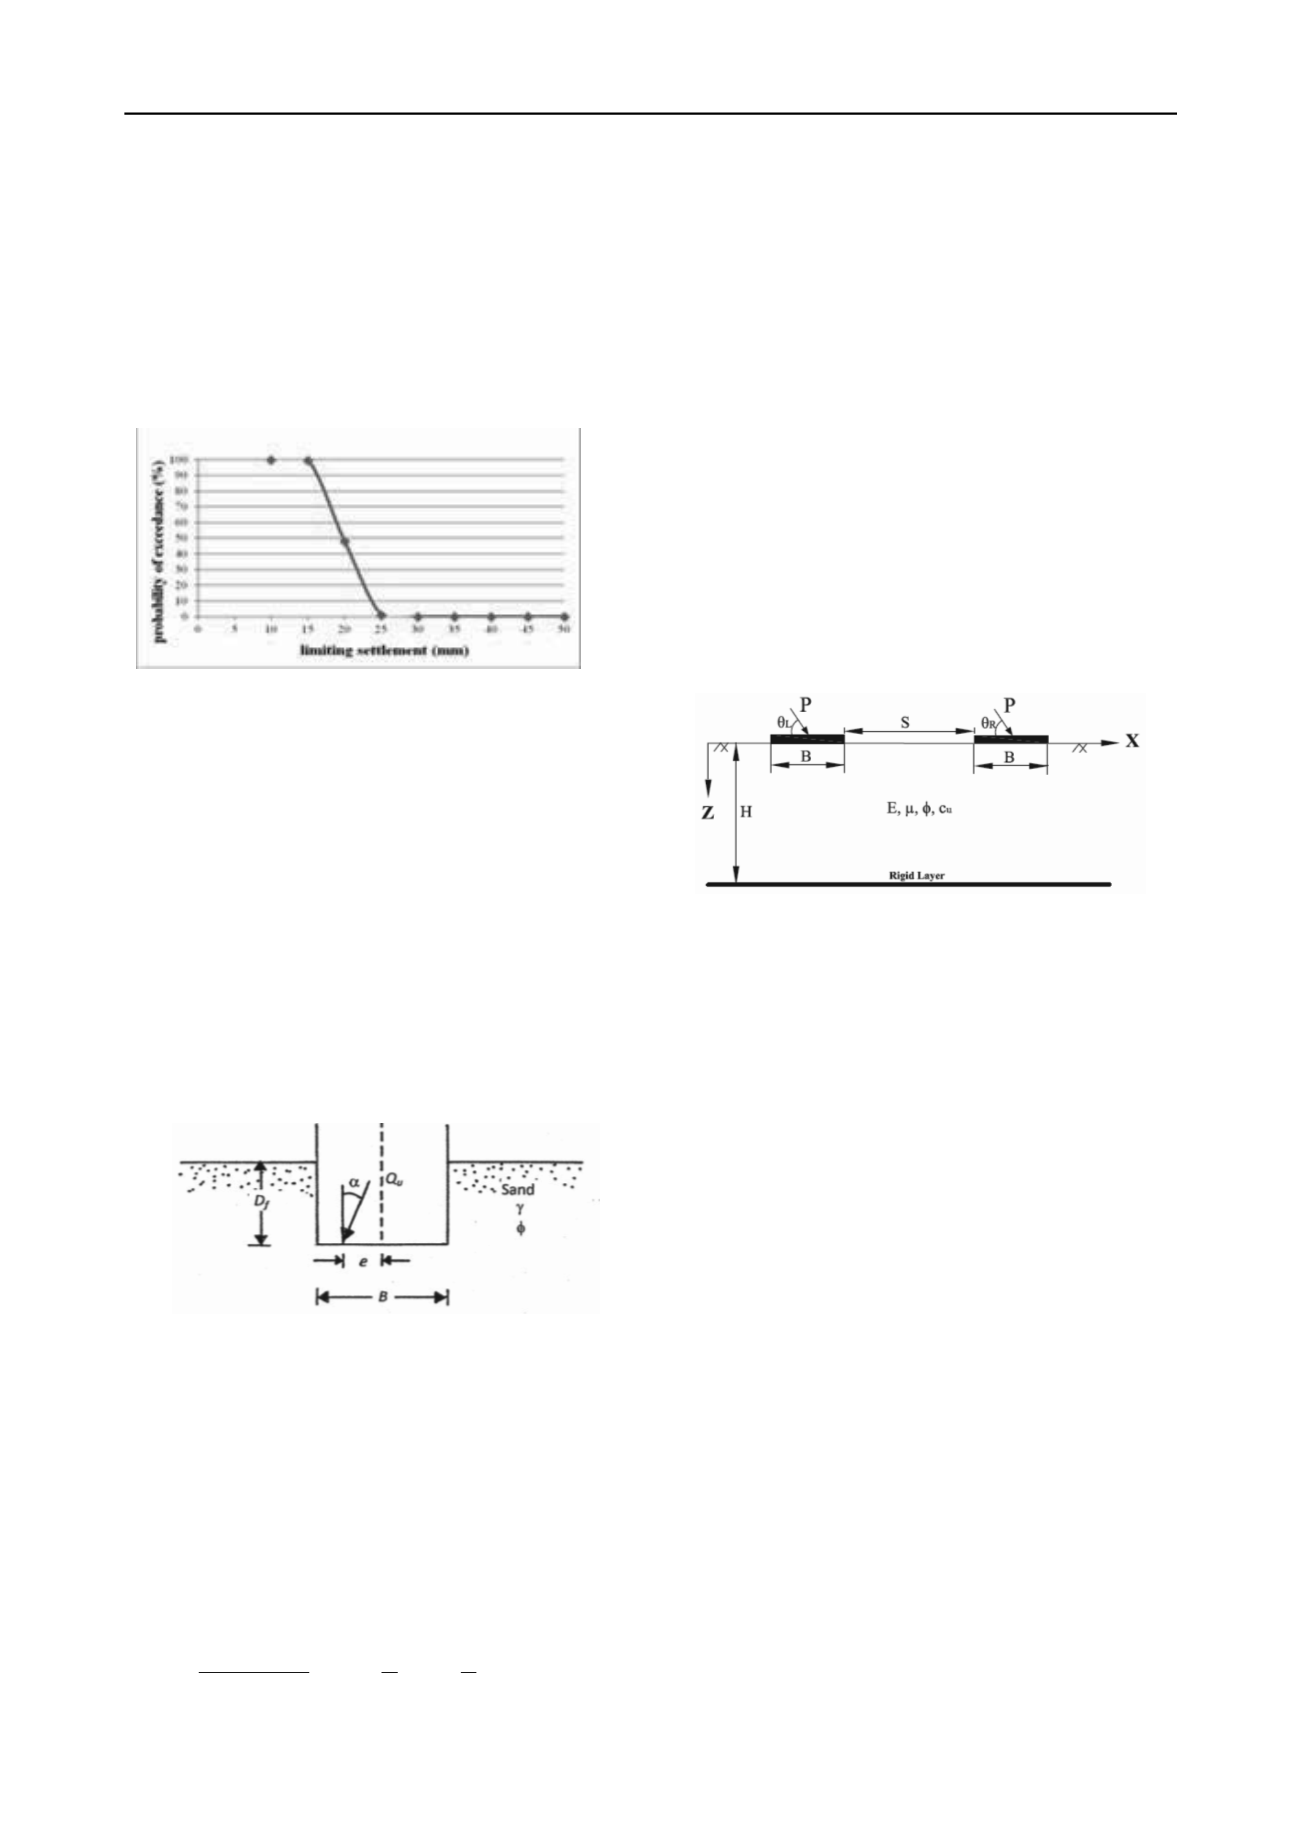
Figure 9 shows the results for the probability of the predicted
settlement to exceed different values of limiting settlements in a
range between 10 to 50 mm. For example, the probability of the
predicted settlement to exceed 25 mm is about 1,1%.
Figure 9. Probability for the predicted settlement, to exceed different
values of limiting settlement.
The analysis of the sources of uncertainties indicates that
about 80% of the settlement variance is influenced by the
uncertainties due to inherent soil variability and measurement
test errors.
4 SHALLOW FOUNDATIONS UNDER INCLINED
LOADING
In their paper,
Atalar &
al.
present laboratory model tests that
were conducted in a dense sand to determine the bearing
capacity of shallow strip foundation subjected to eccentrically
inclined load. The embedment ratio (ratio of the depth of
embedment
Df
to the width of the foundation
B
) was varied
from zero to one.
Figure 10. Shallow foundation on granular soil subjected to
eccentrically inclined load.
Load eccentricity e was varied from zero to 0.15B and the
load inclination with the vertical (α) varied from zero to 20
degrees. Based on the results of the present study, an empirical
non-dimensional reduction factor
RF
has been developed. This
reduction factor (see Eq. (1)) is the ratio of the bearing capacity
of the foundation subjected to an eccentrically inclined load
(average eccentrically inclined load per unit area) to the bearing
capacity of the foundation subjected to a centric vertical load.
It was assumed that, for a given
D
f
/
B
:
n
m
eBDu
eBDu
B
e a
q
q
RF
f
f
1
1
factor
reduction
)0 ,0 , /
(
) ,, /
(
(1)
The determined values of
a ≈ 2
,
m
≈ 1 and
n ≈ 2-(Df/B)
,
based on the test results and within the range of parameters
tested, have been proposed.
A comparison between the reduction factors obtained from
the empirical relationships and those obtained experimentally
shows, in general, a variation of
15% or less. In a few cases,
the deviation was about 25 to 30%.
The interaction of nearby footings resting on homogeneous
soil bed and subjected to vertical and inclined loads has been
studied by
Nainegali
& al.
, from India.
Two rigid strip footings of symmetrical width,
B
rest on the
surface of the homogeneous soil layer of depth H, as shown in
Figure 11.
The two footings are placed at a clear spacing,
S
and an
inclined load,
P
is applied at an angle of inclination
θ
L
and
θ
R
with horizontal on the left and right footings, respectively. The
effect of angles of inclination of load (
θ
L
and
θ
R
) and the clear
spacing between the footings on the ultimate bearing capacity
and settlement are analyzed.
A two dimensional finite element analysis is then carried out
using the commercially available finite element software,
ABAQUS.
Figure 11. Problem definition for footings interaction.
Their study shows that the interference phenomenon has a
considerable effect on the ultimate bearing capacity, increasing
this capacity when footings are vertically loaded. For the cases
where footings are subjected to inclined load the effect of
interference on the bearing capacity has no significant effect.
However for all cases of inclined loading condition, the
interference effect on the settlement is quite significant. The
settlement of interfering footings in the range of working load
decreases with increase in the clear spacing between the
footings and attains a value similar to isolated footing at greater
clear spacing (S ≥ 5B).
5 IMPROVEMENT OF SHALLOW FOUNDATIONS
In their paper,
Kuruoglu &
al.
, from Turkey, study the
settlement improvement factor for footings resting on rammed
aggregate pier groups. They use a 3D finite element program,
calibrated with the results of a series of full scale instrumented
load tests.
Four large plate load tests were conducted with rigid steel
plates of 3.0m by 3.5m. One of the load tests was on non-treated
soil. Second load test was Group A loading on improved ground
with aggregate piers of 3.0m length, third load test was Group B
loading on improved ground with aggregate piers of 5.0m
length and finally fourth load test was Group C loading on
improved ground with aggregate pier lengths of 8.0m.
The aggregate pier groups under each footing, consisted of 7
piers installed with a spacing of 1.25 m in a triangular pattern.
The pier diameter was 65cm. (See Figure 12)


