2999
Technical Committee 215 /
Comité technique 215
3
RESULTS
3.1
Soil-Bentonite Vertical Cutoff Walls
Soil-bentonite (SB) cutoff walls are commonly constructed in
the US using the slurry trench method in which a trench is
excavated and filled with bentonite-water slurry (typically 4-6
% bentonite) to maintain trench stability, the trench spoils are
mixed with dry bentonite (as needed) and slurry to create a
homogeneous, high-slump SB backfill, and the backfill is
placed into the trench to create the wall. The slurry viscosity
must be sufficiently high to maintain trench stability, yet
sufficiently low to be easily displaced by the backfill. The slurry
also should form an adequate filter cake along the trench
sidewalls to minimize slurry loss during construction.
Recommended slurry properties include a Marsh viscosity of
32-40 s and a filtrate loss of < 25 mL (Evans 1993). Also, the
backfill must exhibit a low hydraulic conductivity, typically ≤
10
-9
m/s for geoenvironmental containment applications.
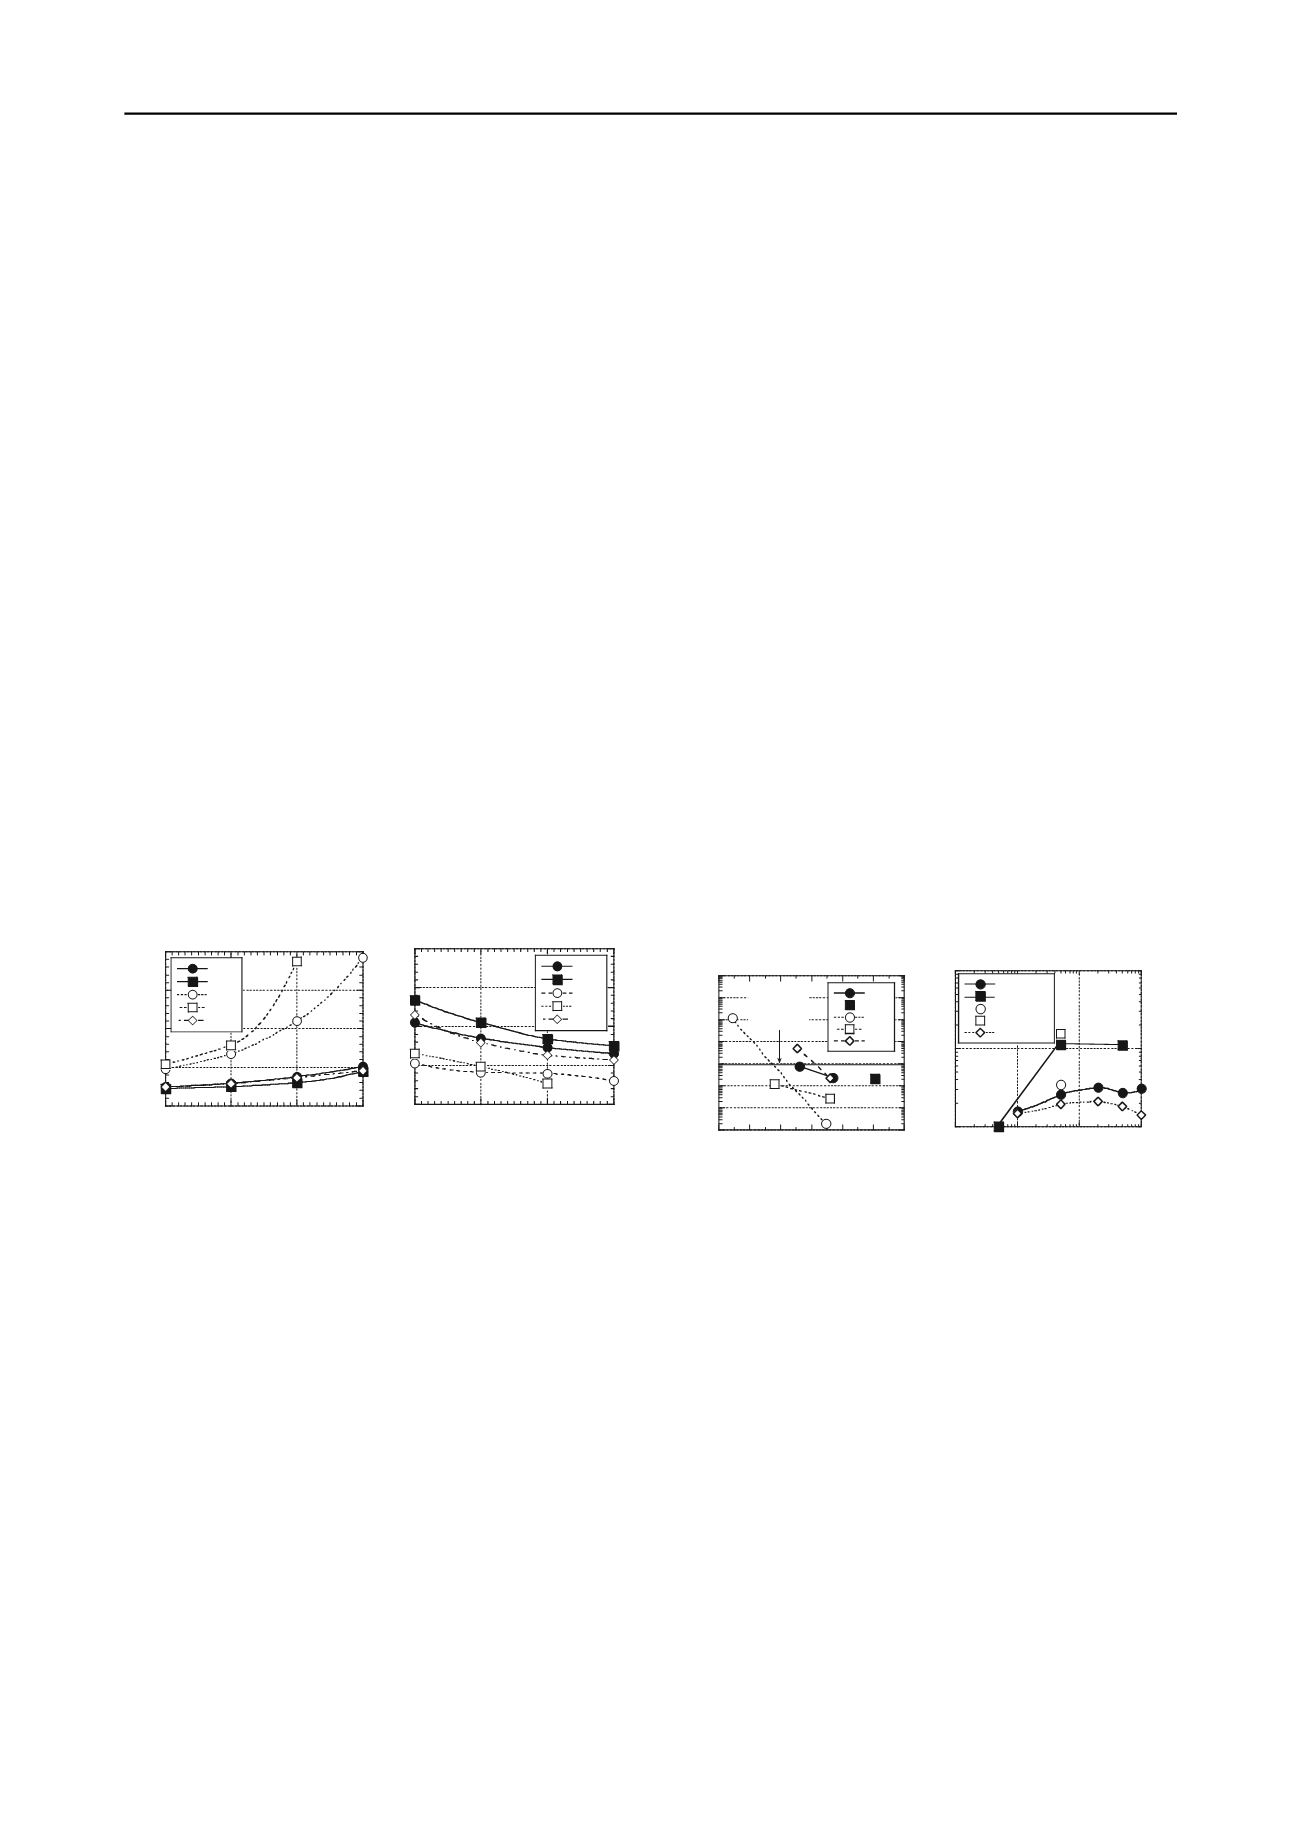
The influence of bentonite content on the Marsh viscosity
and filtrate loss (API 13A-B) of slurry containing untreated
bentonite (NB1, NB2) or treated bentonite (HC8, BPN, MSB) is
illustrated in Fig. 1. Slurries containing 3-5 % NB1, NB2, or
MSB exhibit viscosities within the range of 32-40 s (Fig. 1a).
For these clays, a bentonite content of 5 % likely would be
selected to obtain a greater slurry density and reduce filtrate loss
(Fig. 1b). In contrast, the viscosities of slurries containing ≥ 3
% HC8 or BPN were > 40 s and increased drastically with
increasing bentonite content due to thickening caused by the
polymer. Thus, slurry containing 2 % HC8 or BPN would be
appropriate for slurry trench construction based on viscosity.
Finally, the filtrate losses for 2 % HC8 and BPN are equal to or
lower than the filtrate losses for 5 % MSB or NB1.
20
40
60
80
100
2
3
4
5
(a)
0
10
20
30
40
2
3
4
NB1
NB2
BPN
HC8
MSB
Marsh Viscosity (s)
Bentonite Content (%)
5
(b)
NB1
NB2
BPN
HC8
MSB
Filtrate Loss (mL)
Bentonite Content (%)
Figure 1. Properties of bentonite-water slurries as a function of
bentonite content: (a) Marsh viscosity; (b) filtrate loss (NB1 and MSB
data from Malusis et al. 2010; NB2 and BPN data from Bohnhoff 2012).
Hydraulic conductivity and chemical compatibility of
model SB backfills comprised of sand and NB1, NB2, MSB, or
BPN were investigated in recent studies by Malusis and
McKeehan (2012) and Bohnhoff (2012). Although the sands
used in both studies were clean and poorly graded, the sand
used by Malusis and McKeehan (2012) in the NB1 and MSB
backfills was a fine sand (
D
50
= 0.20 mm) whereas the sand
used by Bohnhoff (2012) in the NB2 and BPN backfills was a
medium sand (
D
50
= 0.45 mm). In both studies, the specimens
were tested in flexible-wall cells at low confining stresses (≤
34.5 kPa). The specimens were permeated with tap water until a
steady
k
w
was achieved, and then were permeated with CaCl
2
solutions (5-1,000 mM) until termination criteria for chemical
equilibrium between the influent and effluent were achieved
(see cited references for further details).
The measured
k
w
values from these studies are presented in
Fig. 2a along with
k
w
values measured recently at Bucknell
University for sand-bentonite backfill specimens containing
HC8 and the same fine sand used by Malusis and McKeehan
(2012). The backfills containing the polymer-modified
bentonites (BPN or HC8) generally exhibited lower
k
w
relative
to the backfills containing similar percentages of MSB or Na-
bentonite (NB1 or NB2), indicating that less BPN or HC8 is
needed to create backfill with an acceptable
k
w
(i.e., ≤ 10
-9
m/s).
The influence of CaCl
2
on the
k
of backfill specimens
containing 5.7 % NB1 or 5.6 % MSB (Malusis and McKeehan
2012) and specimens containing 7.1 % NB2, 2.4 % BPN, and
5.5 % BPN (Bohnhoff 2012) is shown in Fig. 2b. All of the
specimens were susceptible to an increase in
k
, i.e.,
k
c
/
k
w
> 1,
where
k
c
= hydraulic conductivity to the CaCl
2
solution, when
permeated with ≥ 10 mM CaCl
2
solutions. The increases varied
from approximately two-fold to 15-fold depending, in part, on
the bentonite content. For example, the specimen containing
the most bentonite (7.1 % NB2) exhibited the highest
k
c
/
k
w
(~15) of all the specimens. Also, the 2.4 % BPN specimen
exhibited a lower
k
c
/
k
w
relative to the 5.5 % BPN specimen
permeated with the same CaCl
2
solution (50 mM). However,
k
w
for the 5.5 % BPN backfill (2 x 10
-12
m/s) was well below the
typical regulatory limit (10
-9
m/s), whereas
k
w
for the 2.4 %
BPN backfill was unacceptably high (10
-7
m/s; see Fig. 2a).
Thus, the lower BPN content (2.4 %) was advantageous in
terms of chemical compatibility, but was insufficient for
achieving regulatory compliance in terms of
k
.
For the specimens with similar bentonite contents (i.e., 5.7
% NB1, 5.6 % MSB, and 5.5 % BPN), the 5.6 % MSB
specimens exhibited the greatest resilience. The higher values of
k
c
/
k
w
for the 5.5 % BPN specimens relative to 5.6 % MSB and
5.7 % NB1 specimens permeated with the same CaCl
2
solution
were attributed to two primary factors, viz., the greater
reactivity of the 5.5 % BPN specimens, as reflected by the
lower
k
w
for this backfill relative to those containing 5.6 %
MSB or 5.7 % NB1 (see Fig. 2a), and the use of a coarser (i.e.,
more permeable) sand in the BPN backfills relative to the MSB
and NB1 backfills. However, the lower
k
w
for the 5.5 % BPN
backfill also allowed for a greater increase in
k
to occur without
exceeding the typical regulatory limit of 10
-9
m/s.
10
-12
10
-11
10
-10
10
-9
10
-8
10
-7
10
-6
10
-5
2 3 4 5 6 7 8
(a)
NB1
NB2
BPN
HC8
MSB
Hydraulic Conductivity,
k
w
(m/s)
Bentonite Content (%)
Typical
Regulatory
Limit
1
10
100
1
10
100
1000
(b)
5.7 % NB1
7.1 % NB2
2.4 % BPN
5.5 % BPN
5.6 % MSB
k
c
/
k
w
CaCl
2
Concentration (mM)
Figure 2. Permeation results for sand-bentonite backfills: (a) hydraulic
conductivity to water,
k
w
, as a function of bentonite content; (b) ratio of
hydraulic conductivity to CaCl
2
solution,
k
c
, relative to
k
w
as a function
of CaCl
2
concentration (NB1 and MSB data from Malusis and
McKeehan 2012; NB2 and BPN data from Bohnhoff 2012).
3.2
Geosynthetic Clay Liners (GCLs)
Values of
k
c
for BPN, HC2, and MSB specimens representing a
typical GCL are shown in Fig. 3a. Data for specimens of Na-
bentonite taken from actual GCLs (Bentomat
®
DN, CETCO,
USA) are included in Fig. 3a for comparison. All specimens
were permeated in flexible-wall cells under low effective
stresses (14 to 30 kPa) until the hydraulic termination criteria of
ASTM D 5084 were satisfied. Also, most of the specimens were
permeated until chemical equilibrium (defined as the ratio of
outflow and inflow electrical conductivity within 1.0 ± 0.1) was
achieved, with the exceptions being the specimens permeated
with deionized water (DIW) and the HC2 specimens. The
results reflect a "worst-case" testing condition in that the
specimens were not prehydrated prior to permeation
(Shackelford et al. 2000). Permeation with DIW (plotted at 0.1
mM CaCl
2
in Fig. 3a) resulted in low
k
w
(i.e., 4.2 x 10
-12
to 3.4 x
10
-11
m/s) regardless of the bentonite type. However, the BPN,
HC2, and MSB exhibited superior hydraulic behavior (i.e.,
lower
k
c
) relative to the GCL bentonites. These results illustrate
the potential advantage of novel bentonites in solutions typically


