3003
Technical Committee 215 /
Comité technique 215
view to estimate the durability of a cement-bentonite cut-off
wall on the basis of the flow rate through it (i.e. on the basis of
the hydraulic boundary conditions and assuming, safely, the
minimum hydraulic conductivity value measured at brief
curing). Since a high value of PV* results in case of low
concentration of SO
4
, this means that a good long term
performance can be always expected because the hydraulic
conductivity values after few months of curing are sufficiently
low so that very few pore volumes of flow can pass through a
cut-off wall in case of typical hydraulic heads of the order of
units.
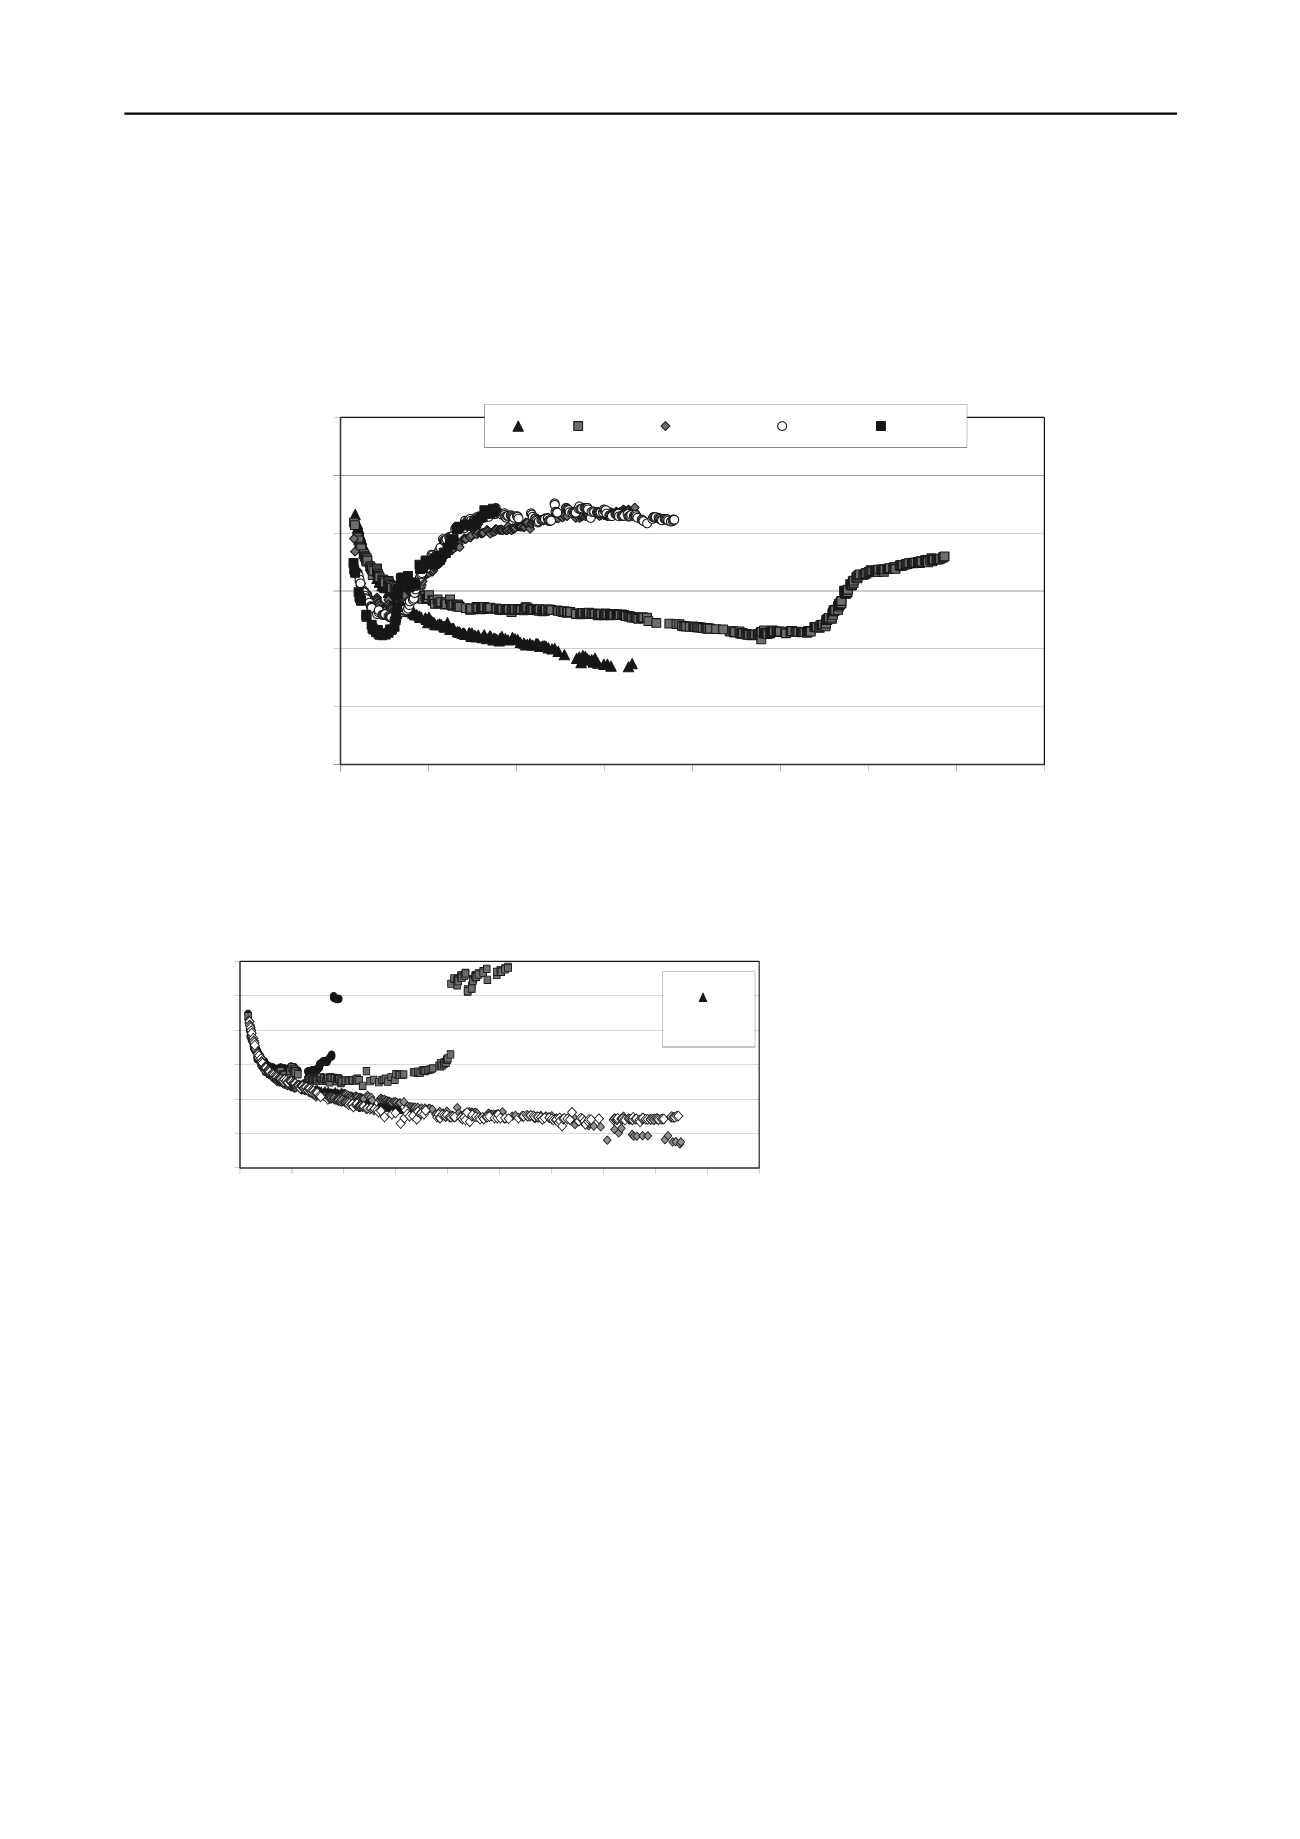
1,E-10
1,E-09
1,E-08
1,E-07
1,E-06
1,E-05
1,E-04
0
100 200 300 400 500 600 700 800
k (cm/s)
curing time (days)
R 5 g/l
27.5 g/l
50 g/l
95 g/l
Figure 1. Hydraulic conductivity trend with curing time of the sample of the CB mixture permeated with water (R) and with solutions of K
2
SO
4
at
different concentrations (in the legend)
1,E-10
1,E-09
1,E-08
1,E-07
1,E-06
1,E-05
1,E-04
0 100 200 300 400 500 600 700 800 900 1000
k (cm/s)
curing time (days)
R
Figure 2. Hydraulic conductivity trend with curing time of the sample of the CB mixture permeated with water (R) and with solutions of H
2
SO
4
at
different pH (in the legend)


