2491
Technical Committee 211 /
Comité technique 211
investigate enzymatic ureolytic CaCO
3
precipitation in a finer
grained material. The specimen was prepared in the same
manner as described for the triaxial columns for the Ottawa 20-
30 sand. The cementation fluid for the first of the two
applications contained approximately 2.0 g/L enzyme, 400 mM
urea (reagent grade, Sigma-Aldrich), 300 mM CaCl
2
-2H
2
O
(laboratory grade, BDH) at pH=7.7. The fluid for the second
application contained 1 M urea-CaCl
2
-2H
2
O solution at pH=7.8
without any enzyme. After the test, the triaxial specimen was
washed and subject to acid digestion in the same manner as the
Ottawa 20-30 triaxial specimens.
3. RESULTS
3.1
Acrylic Tubes
Approximately 100 ml of cementation solution was delivered
per application for the first application in each acrylic tube.
However, the amount of solution the tube would accept was
notably reduced in subsequent applications, when less than 75
ml was typically required to fill the tubes to ≈ ½ inch (12 mm)
above soil line. At the conclusion of the experiment,
precipitation was visible along the entire length of tubes 1 and
2. Internally the cementation was variable, with some highly
cemented zones and other zones with little to no cementation.
Tube 1 yielded mostly small, loose chunks of sand with
strong effervescence upon digestion. Most of this column
appeared un-cemented and exhibited unusually viscous behavior
when wet. A fairly large (compared to column diameter) piece
of strongly cemented sand (not breakable without tools) formed
in the deepest layer of tube 1. Tube 2 had many small chunks
of weakly cemented sand with strong effervescence upon
digestion. Tube 3 had little to no precipitation in the top layer
(i.e. this layer did not show any indication of carbonate upon
acid digestion.) The deepest layer of tube 3 contained many
pieces of weakly cemented sand that effervesced strongly upon
digestion. The middle layer of tube 3 contained a few pieces of
cemented sand that effervesced moderately upon digestion. The
results from the acid washing are presented in Table 1.
Table 1. Results from
Experiment Set 1
using 20-30 Ottawa silica sand
Summary of Results
Tube #
Layer
Weight
Change via
Digestion
Amt.
of
CaCO
3
(g)
Total
Amt.
CaCO
3
(g)
Theor.
Max
CaCO
3
(g)
1
11%
3.57
2
3.8%
1.67
3
2.7%
1.73
4
2.1%
1.40
5
2.3%
1.74
1
6
2.0%
1.64
11.8
≈14.5
1
0.76%
0.63
2
0.65%
0.69
2
3
0.49%
0.75
2.07
≈ 4.35
1
0.23%
0.31
2
0.58%
0.63
3
3
1.7%
2.63
3.57
≈ 4.35
The theoretical maximum CaCO
3
content is the stoichiometric
maximum balanced on initial concentrations. The primary
experimental differences between the tests are (1) the number of
applications of cementation fluid and (2) the manner in which
the urease was delivered. The results indicate that there is
greater carbonate precipitation with increasing number of
applications, as expected. The data show more precipitation in
(or on) the top layer of tubes 1 and 2 but not in tube 3, as the
enzyme was physically confined to the lower-third layer in tube
3 during sample preparation. In the top layer of tube 3, where no
urease was mixed with the sand, carbonate precipitation was
nearly undetectable. There was no visual evidence of
precipitation and practically no measurable change in weight of
this layer after acidification (weight change = 0.23%). In the
bottom layer of tube 3, where 3 g of dry enzyme was mixed
with the soil, there was a weight change of 1.7% following acid
washing. The middle layer of this specimen had a minor change
in weight (0.58%), possibly due to uneven distribution of the
layers during preparation or splitting of the specimen or to
upward migration of urease from the bottom layer.
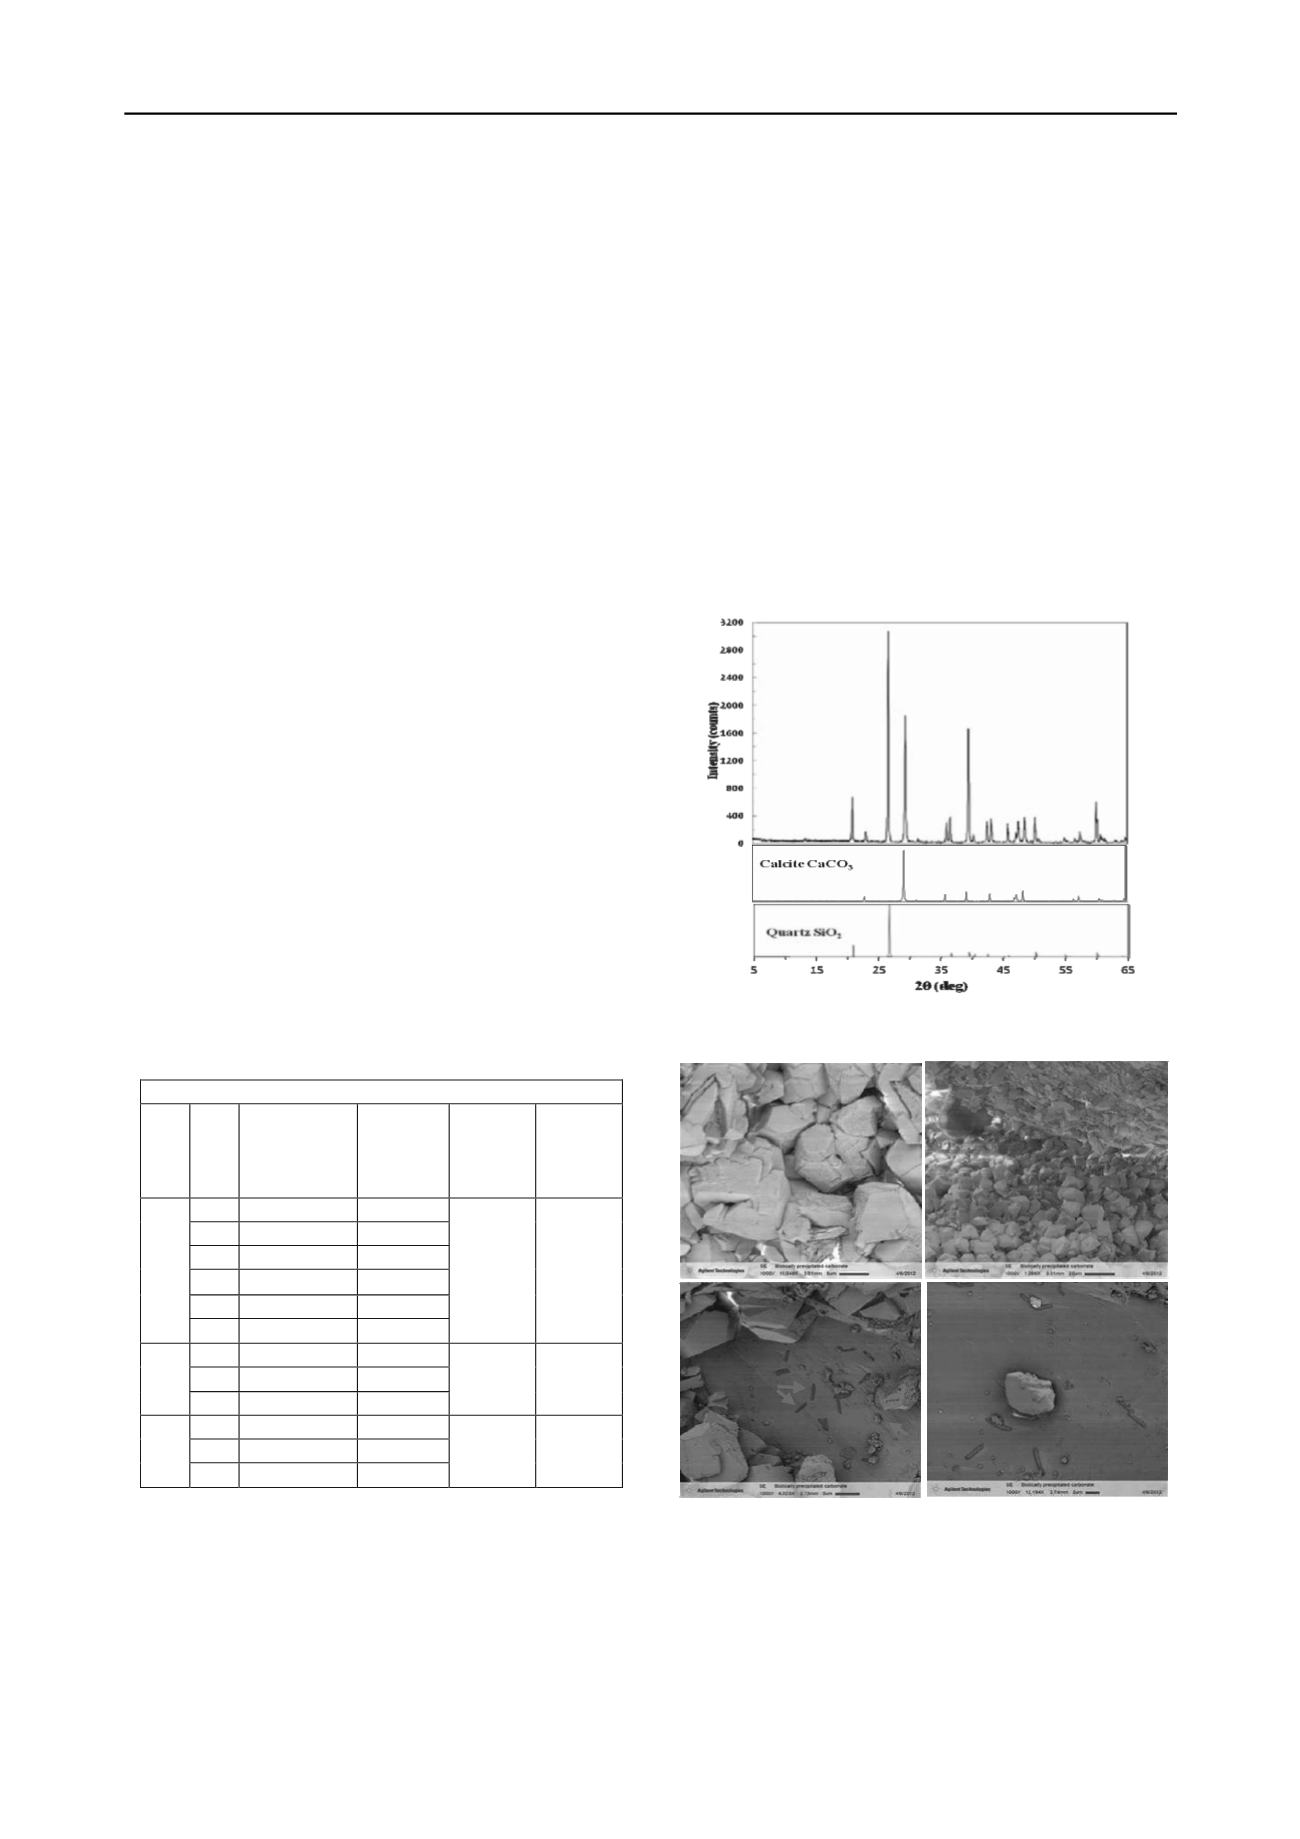
XRD analysis, presented in Figure 1, confirms that calcite is the
mineral phase present in the cemented soil chunks. LV-SEM
images, presented in Figure 2, show silica (quartz) sand
particles cemented with calcium carbonate and various
morphological features associated with the cementation process
on the silica surface.
Figure 1. XRD results from cemented sand sample (top plot). Quartz &
calcite standards (middle & bottom plot, respectively).
B
A
C
D
Figure 2. LV-SEM images a.) Well-grown and cementing calcite crystals;
b.) Cementing calcite crystals at inter-particle contact; c.) Indention of quartz
surface (blue arrows) and nucleation of calcite crystals (red arrows); d.) Calcite
crystal growing on quartz surface.
3.2 Triaxial Columns
The three triaxial sand columns (2 Ottawa 20-30 sand columns
and 1 Ottawa F-60 sand column) were tested in drained triaxial
compression prior to acid digestion. All three columns were
able to stand upright after removal of the split mold. The results


