2488
Proceedings of the 18
th
International Conference on Soil Mechanics and Geotechnical Engineering, Paris 2013
5
SUMMARY AND CONCLUSION
The total and effective stress analysis on two tested piles driven
in improved ground of Thi Vai Port is performed and
summarized as:
0
5
10
15
20
25
30
0
500
1,000 1,500 2,000
SHAFT RESISTANCE (KN)
DEPTH (m)
Sandy silt and silt
Eq. 8
Eq. 9
β = 0.3
P
I
L
E
2
2
m
P
I
L
E
1
6
m
Sand
Clay
For total stress approach, the analysis indicates the
alpha method with a reduction coefficient
incorporated into the API 1987 edition gave the best
agreement.
For effective stress approach, the analysis shows the
Eslami and Fellenius method (1997) is approximately
the same as the measurements.
For two approaches, the total stress approach is the
better agreement.
Correlation coefficient, N
KT
, between CPTU pore
pressure adjusted cone stress and vane shear stress is
about 18.
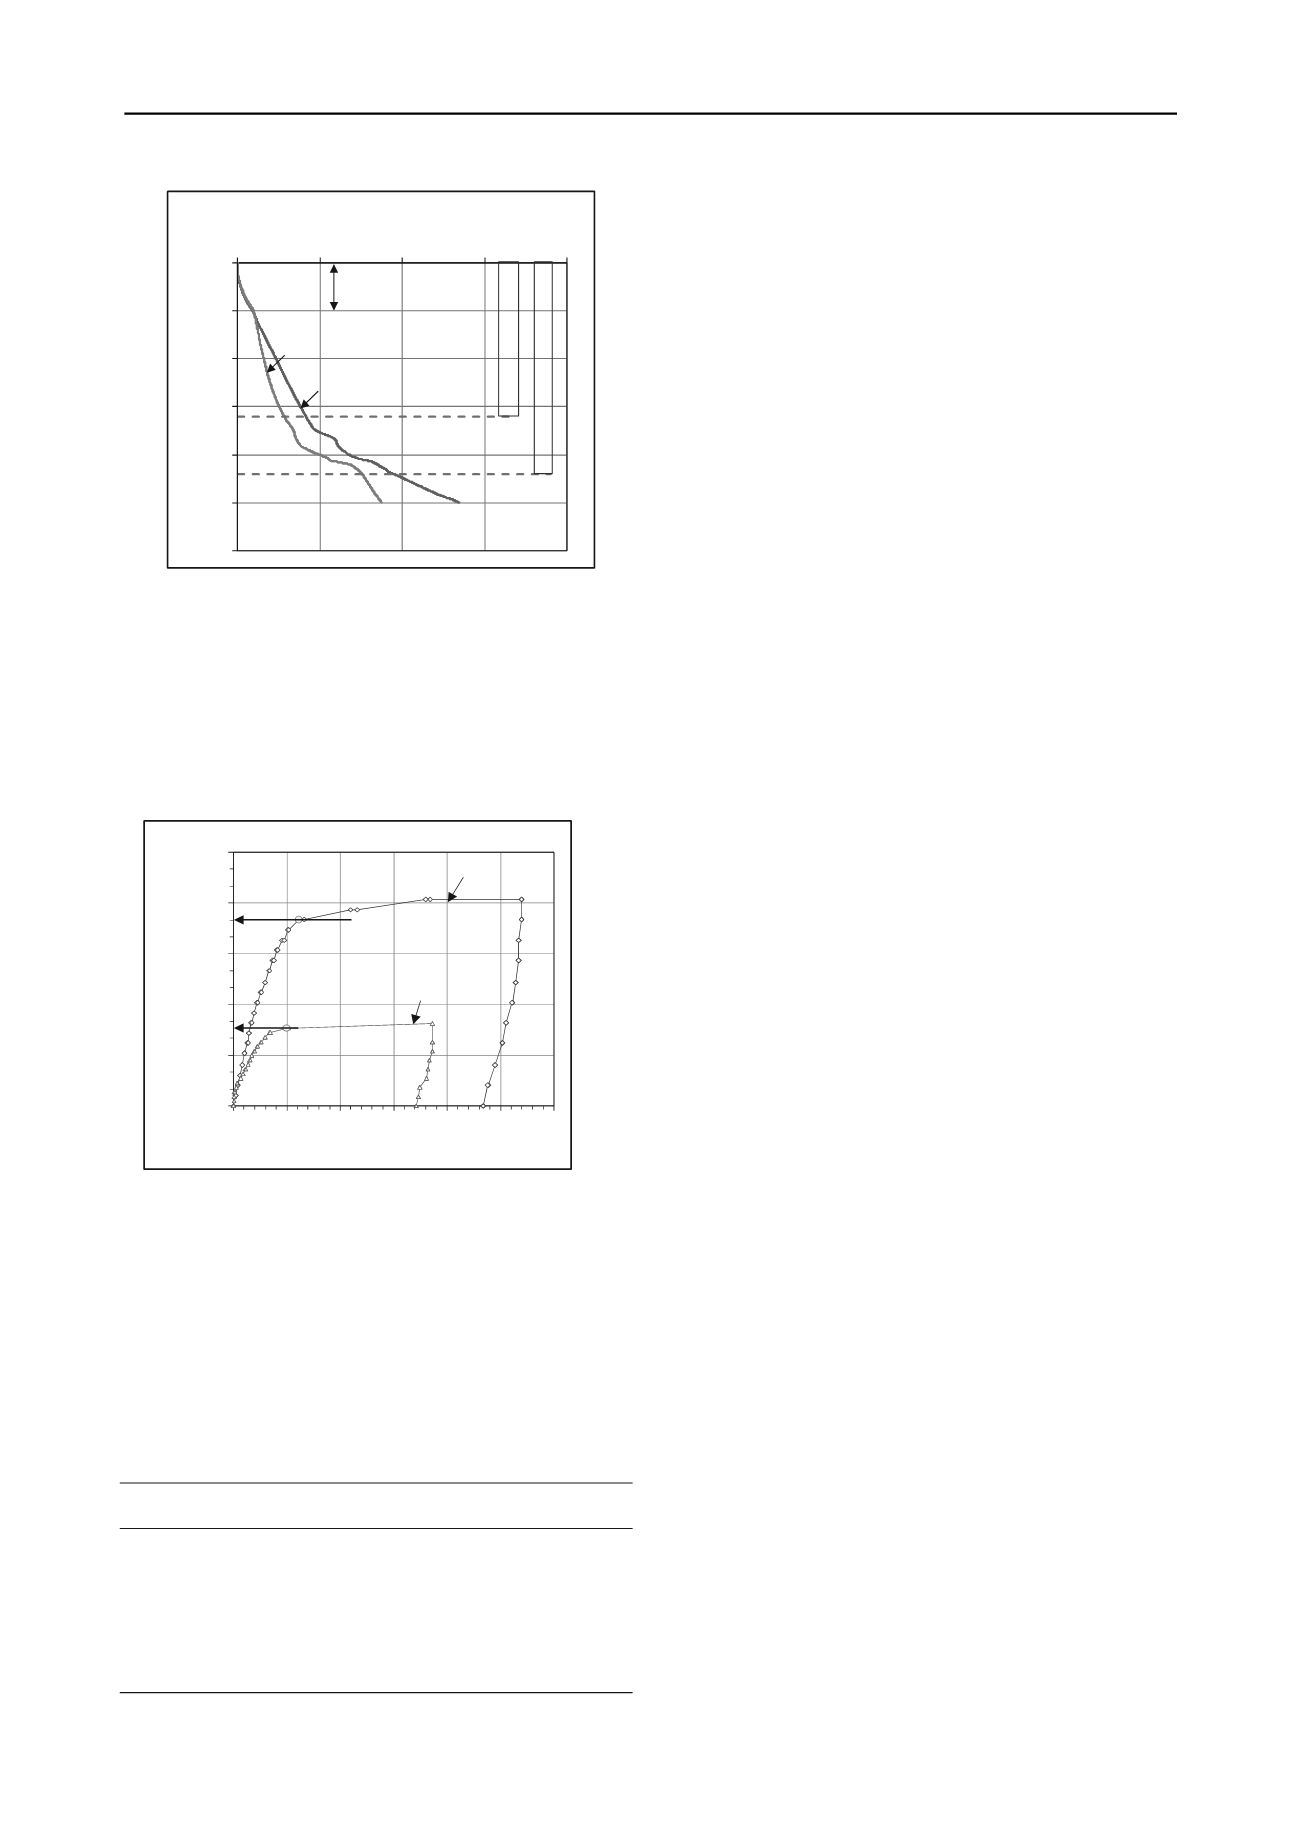
Figure 9. The accumulated shaft resistances versus depth
6
REFERENCES
1.2
Pile test results and evaluation of approaches
The static loading tests for the 22 and 16 m Pile were performed
after piles driven about 23 and 14 days, respectively. The 22
and 16 m were tested on September 29, 2011 and November 22,
2011. The load-movement curves of the two tested piles in
Figure 12 indicate the ultimate loads of the plunging failures at
1,100 and 459 KN, respectively.
API (1987) Recommended practice for planning, designing, and
constructing fixed offshore platforms, API RP2A, 17th edn.
American Petroleum Institute, Washington.
API (1993) Recommended practice for planning, designing and
constructing fixed offshore platforms—working stress design, API
RP2A, 20th edn. American Petroleum Institute, Washington.
Cai G., Songyu L., Liyun T., Guangyin D. 2009. Assessment of direct
CPT and CPTU methods in predicting the ultimate bearing capacity
of single piles.
Eng Geol
104:211–222,.
0
300
600
900
1,200
1,500
0 5 10 15 20 25 30
LOAD (KN)
MOVEMENT (mm)
Pile 16
m
Pile 22 m
1,100 KN
459 KN
Eslami A., Fellenius B.H. 1997. Pile capacity by direct CPT and CPTu
methods applied to 102 case histories.
Can Geotech J
34:886–904.
Fellenius B.H. 2008. Effective stress analysis and set-up for shaft
capacity of piles in clay.
ASCE Geotechnical Special Publication,
GSP
180:384-406.
Karlsrud K., Haugen T. 1981. Cyclic loading of piles and pile anchors,
field model tests at Haga. Norwegian Geotechnical Institute
Research Report.
Kolk H.J., van der Velde E. 1996. A reliable method to determine the
friction capacity of piles driven into clays. In: Proceedings of the
28th annual offshore technology conference, Houston, pp 337–346.
Lunne, T., Christoffersen, H.P. and Tjelta, T.I. 1985. Engineering use of
Piezocone data in North Sea Clays. Proceedings XI ICSMFE, San
Francisco.
Murff D. 1980. Pile capacity in a softening soil. Int J Numer Anal
Methods Geomech 4:185–189.
Figure 10.
Pile-head load-movement curves of two static
loading tests performed on 22 and 16 m pile.
Randolph M.F., Murphy B.S. 1985. Shaft capacity of driven piles in
clay. In: Proceedings of the 17th annual offshore conference,
Houston, pp 371–378.
Normally, the plunging failures of the test piles are found
when the pile toe is in soft clay as in the subject case and the
pile toe resistance can be disregarded when evaluating the
analysis methods. Performance of two approaches are evaluated
basing on ratio of the estimated capacities, Qp, to the measured
capacities, Qm. Table 1 shows the performance evaluation of
two approaches for the measured pile capacities.
Semple R.M., Rigden W.J. 1984. Shaft capacity of driven pipe piles in
clay. In: Proceedings of the on analysis and design of deep
foundations, San Francisco, pp 59–79.
Takesue, K., Sasao, H., Matsumoto, T. 1998. Correlation between
ultimate pile skin friction and CPT data.
Geotechnical Site
Characterization (2)
: 1177-1182. Rotterdam: Balkema.
Table 1.
Evaluation on performance of the total and effective
pproach for predicting the pile capacity.
a
Pile 16 m Pile 22 m
(Qp/Qm) (Qp/Qm)
Total stress approach
Eq. 1
0.967
0.949
Eq. 4
1.422
1.416
Eq. 5
1.048 1.280
Eq. 6
1.203 1.423
Effective stress approach
Eq. 8
0.915 0.884
Eq. 9 0.624 0.688


