2486
Proceedings of the 18
th
International Conference on Soil Mechanics and Geotechnical Engineering, Paris 2013
0
5
10
15
20
25
0 20 40 60 80 100
DEPTH (m)
WATERCONTENT (%)
w
P
w
n
w
L
+ 5.0 m
+4.0 mGWL
w
n
w
n
0
5
10
15
20
25
0 20 40 60 80100
DEPTH (m)
0
5
10
15
20
25
0 20 40 60 80 100
DEPTH (m)
GRAIN SIZE DISTRIBUTION
CLAY SILT
SILT
SILT
CLAY
SAND
SAND
SAND GRAVEL
CLAY
FIELDVANE STRENGTH
S
U
(KPa)
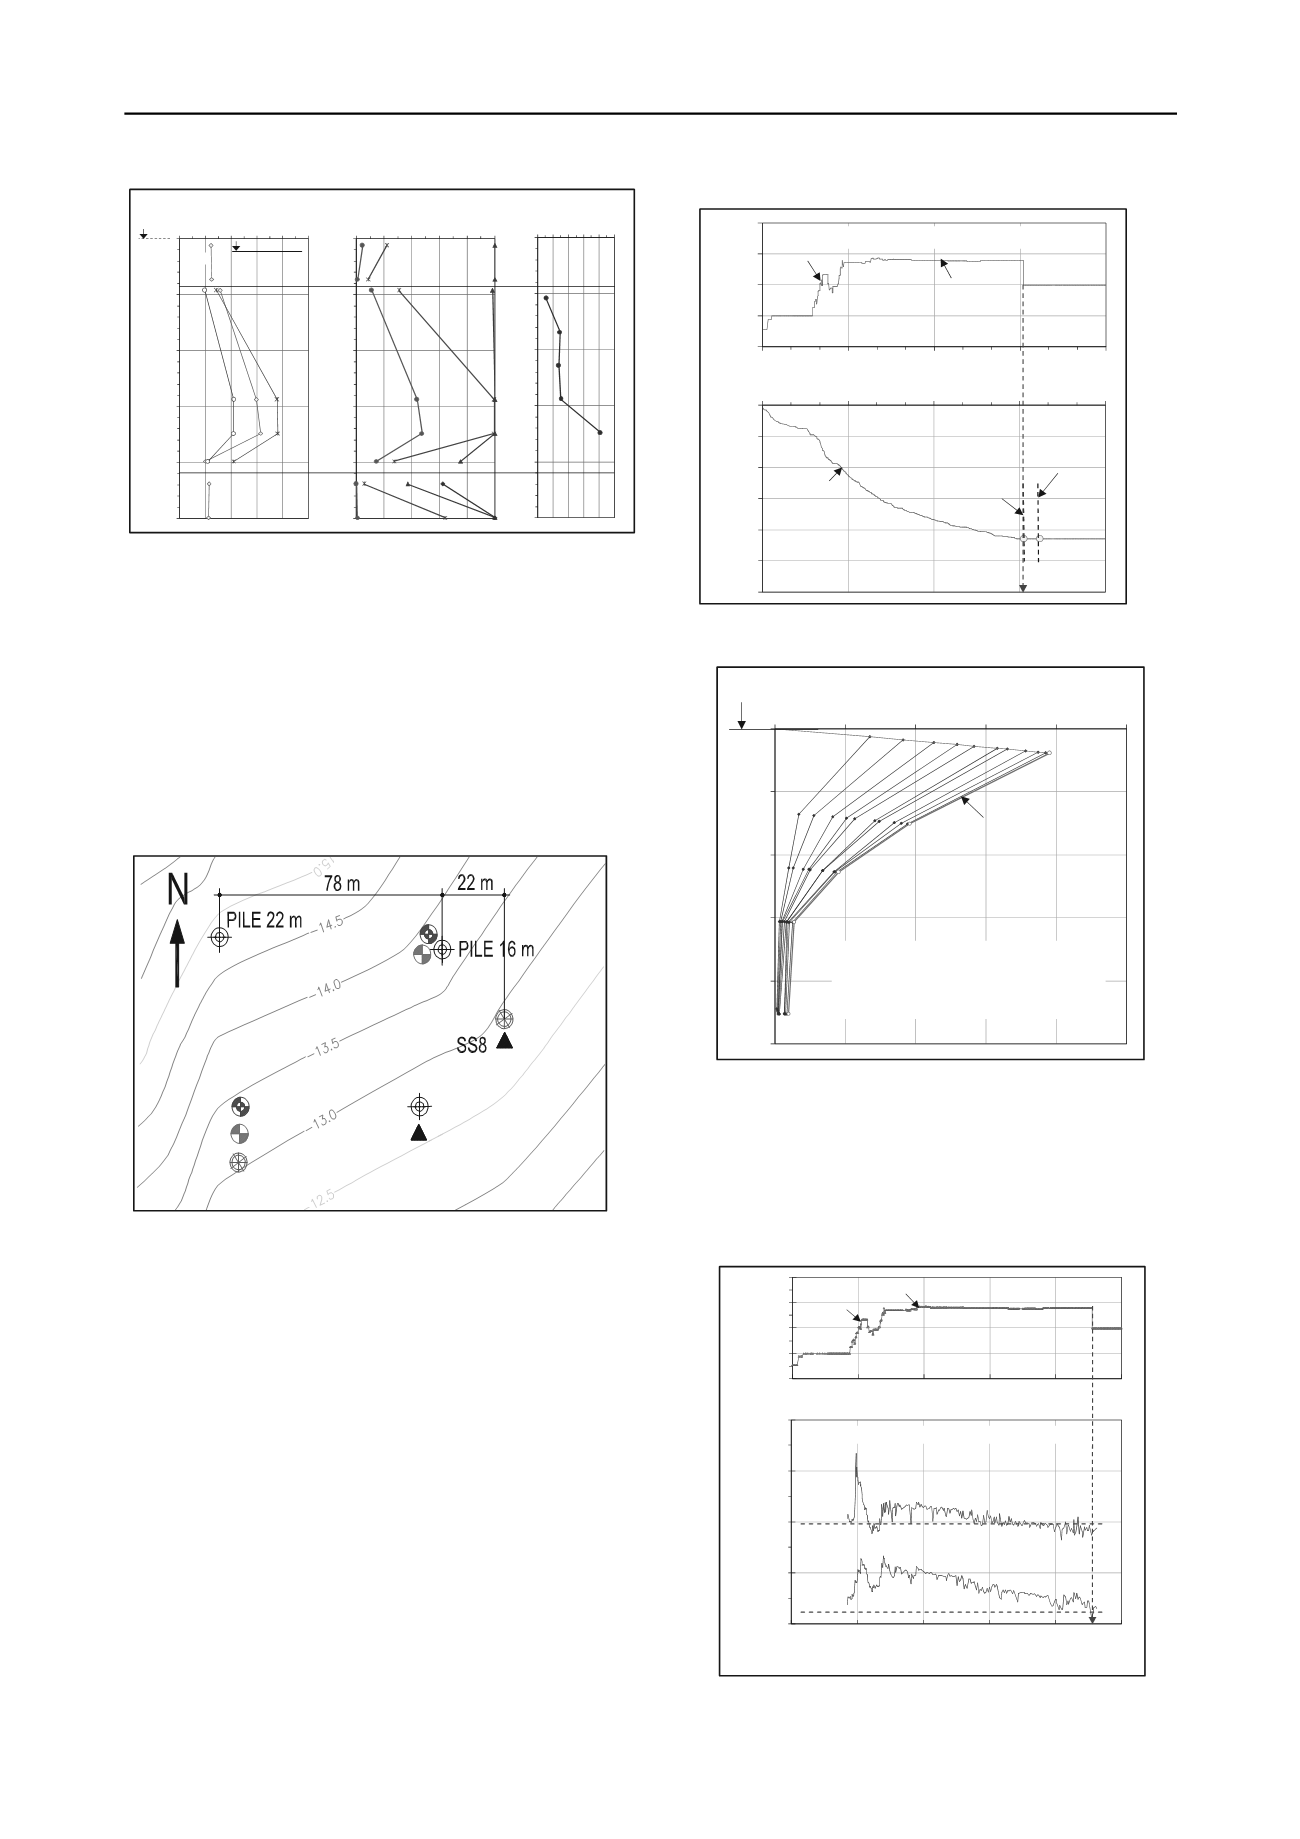
Figure 2. Water content and Atterberg Limits, grain size
distribution, and field vane strength
3
SOIL IMPROVEMENT AND MEASUREMENTS
Figure 3 shows the location of SS8 settlement benchmark was
installed on the original ground surface before the placing of
the fill. Pore pressure measurement was performed by
piezometer tips installed at depths of 6.5 m and 15.2 m.
Settlement distribution with elevations was measured by means
of extensometer gages placed at elevations of +5 m, -1.6 m, -
5.9 m, -10.3 m and -17 m in the clay. Figure 4 also indicates
location of field soil tests and test piles.
Figure 3. Locations of test piles, borehole, CPTU, VST, and
field instrumentation
Figure 4 shows the settlements measured at SS8 plate near
the tested piles. Day 0 is March 12, 2009 and the total
settlement measured after completed removal of surcharge
was about 2.15 m. Removal of surcharge at the 22 and 16 m pile
was completed on August 22, 2011 and September 9, 2011,
respectively. 15 and 60 days after removal of surcharge, the 22
and 16 m test pile was driven on September 6, 2011 and
November 8, 2011, respectively, to serve for test and design of
building foundation.
Figure 5 shows the settlement distribution with depth as
measured at extensometer station, next to the SS8 at 4.6, 8.9,
13.3, and 20 m depths below the original ground surface from
August 29 through June 30, 2011. The extensometer station had
to be removed on June 30, 2011 before the test pile driven. The
four settlements anchors were referenced to the presumed zero
for the fifth anchor point placed at 20 m depth. The settlement
distribution is almost linear from the fill surface to zero at 15 m
depth.
0
50
100
150
200
0
300
600
900
1,200
FILL STRESS (KPa)
SS8
Temporary
stockpile
March 12, 2009 - June 24, 2012
0.0
0.5
1.0
1.5
2.0
2.5
3.0
0
300
600
900
1,200
SS8
SETLLEMENT (m)
16 mTest
Pile Driving
22 mTest
Pile Driving
TIME (day)
Figure 4. Fill stress versus settlement
0
5
10
15
20
25
0.0
0.5
1.0
1.5
2.0
2.5
June 30, 2011
August 29, 2009 — June 30, 2011
Zero Reading was taken on August
29, 2009. Total settlement of top sensor
was about 1.95 m. The dark blue curves
show readings spaced about two
months apart.
+ 5.0 m, Elevation of top sensor
SETTLEMENT (m)
DEPTH (m)
CPTU and VST
BHs
Test Piles
Settlement Plates
Extensometer, Piezometer, and Standpipe
Figure 5. Distribution of settlement versus depth
Figure 6 shows the pore pressures measured at Elev. -1.5 m
and -10.2 m from August 29, 2009, through September 23,
2011. The Piezometer had to be removed before driving the test
piles. As shown in Figure 6, the pore water pressures seem to be
equal to the hydrostatic pressures after removing the surcharge.
50
100
150
200
250
0
200
400
600
800 1,000
-1.5 m
TIME (Day)
-10.2 m
PORE WATER PRESSURE (KPa)
August 29, 2009 - September 23, 2011
0
50
100
150
200
0
200
400
600
800 1,000
SS8
FILL STRESS (KPa)
Temporary
stockpile
Figure 6. Pore water pressure versus fill stress


