2483
Technical Committee 211 /
Comité technique 211
and mixture were calculated by dividing the UCS and
by the
maximum values (
UCS
max
and
max
) obtained from all the
employed molding techniques. The normalizations are
necessary to allow direct comparison between two parameters
with different unit of measurements. According to the Eq. 1 the
N
parameter values range between 0 and 1. In order to define a
criteria for the choice of the applicable techniques, it was set the
acceptable limit of 0.9
N
considering a variation of 10 % from
the maximum
N
value.
(1)
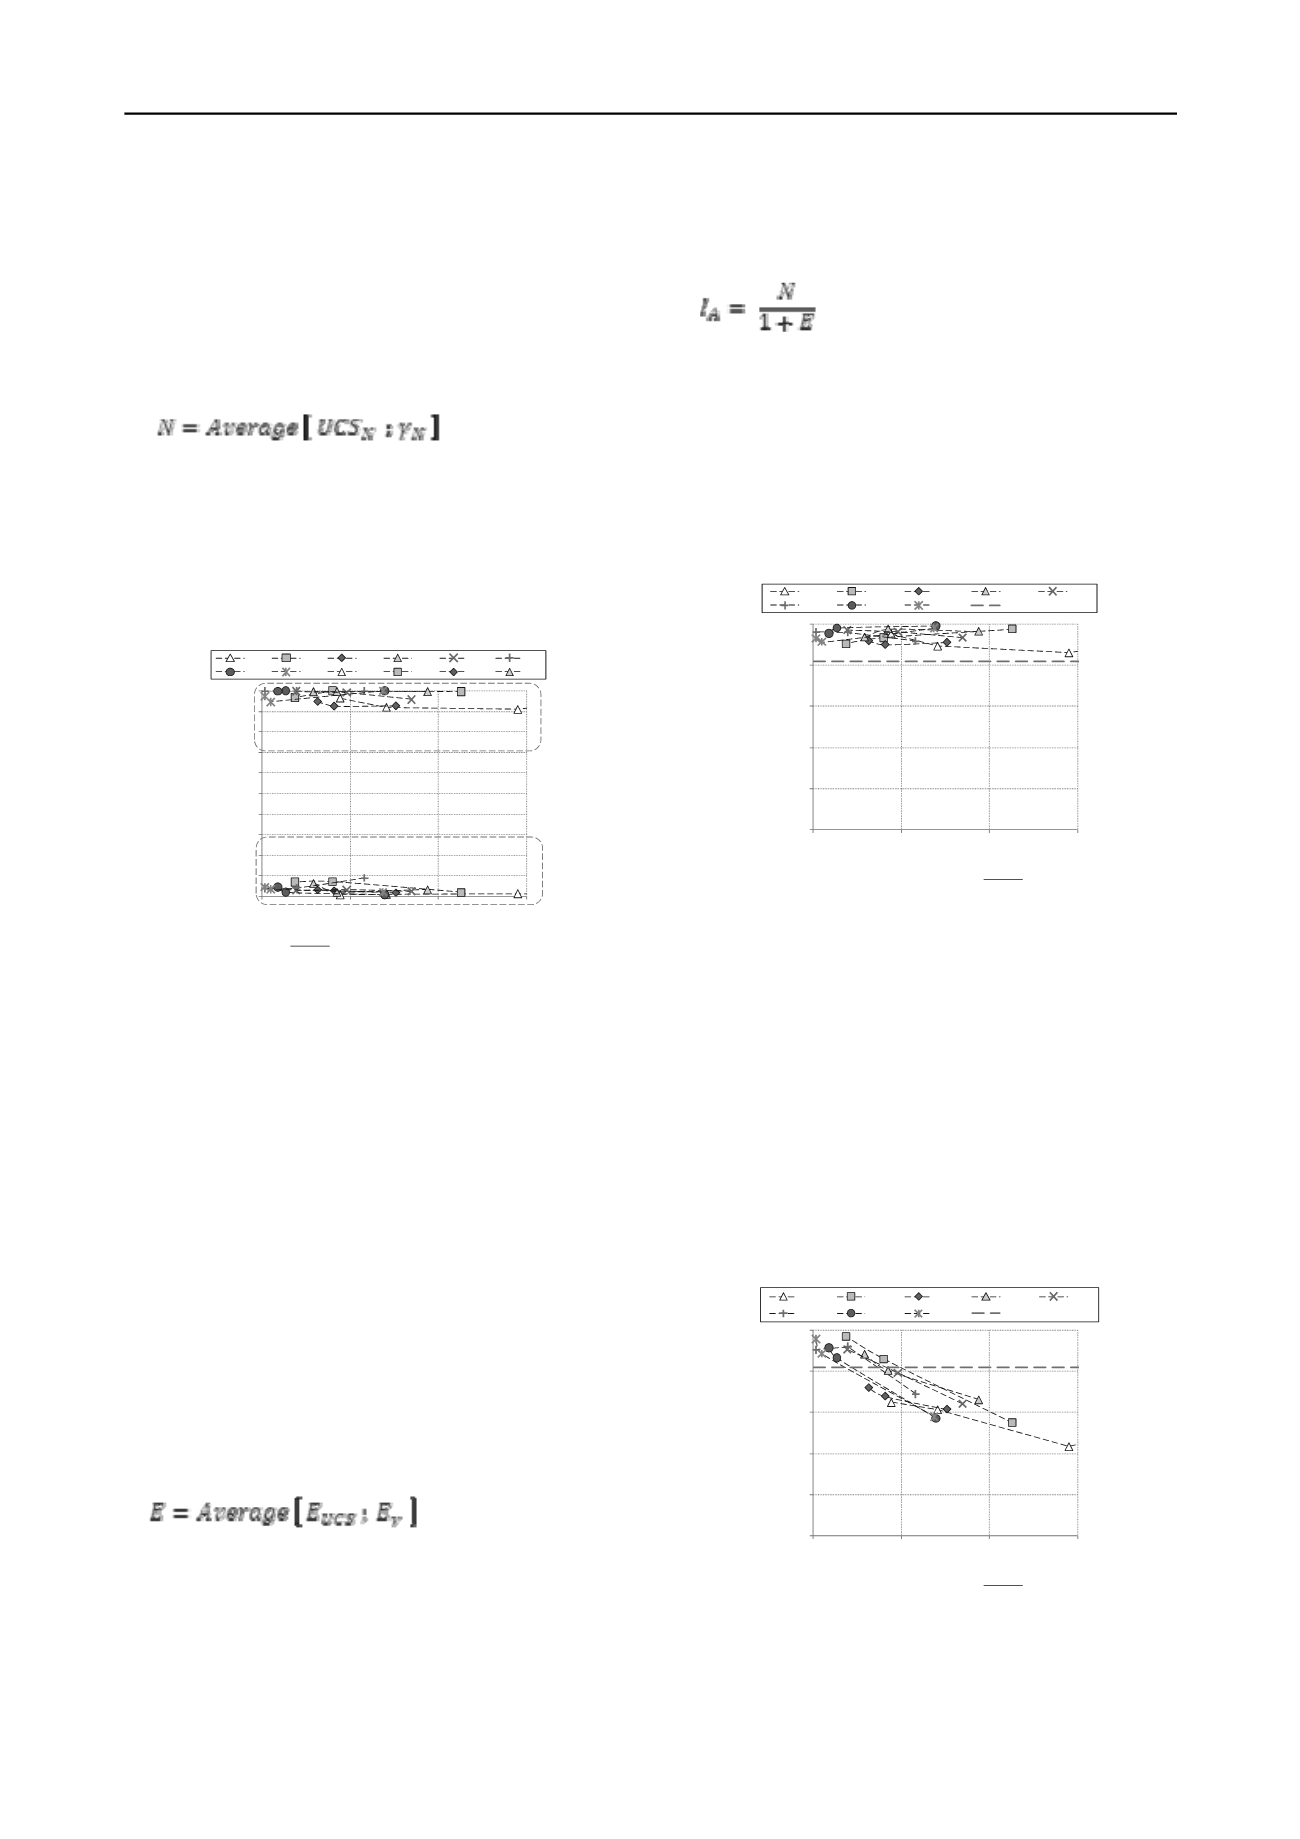
The Figure 2 shows as example the
N
parameters vs. torque
values obtained for all the analyzed soil-binder mixtures molded
by the Rodding technique. From the figure clearly appears that
for all the measured mixtures workability the
N
values are
above the set limit as an expression of the high quality of the
specimens realized by Rodding.
0.0
0.1
0.2
0.3
0.4
0.5
0.6
0.7
0.8
0.9
1.0
0
6
12
18
N
,
E
parameter
mixture workability, Torque
M
t
(Nm)
KC SD SS SG PC BP
RP AT KC SD SS SG
RODDING
28 days
N
parameter
limit = 0.90
E
parameter
limit = 0.10
Figure 2. Applicability of Rodding technique considering the
N
and
E
parameters.
Despite the
N
-parameter is a good indicator of the
applicability of a molding technique, to take into account that
the applicability should be also related to the “repeatability” of
the tests results the
E
-parameter was introduced. Repeatability
means that the results related to the specimens produced by a
specific molding technique should have a low “scatter” or
relative error. Unconfined compression tests was conducted on
triplicate samples for each case analyzed, therefore it was
possible to evaluate the relative error on the unconfined
compressive strength and wet density values for the different
mixtures types and molding techniques.
E
is defined as the
mean of the relative error on the UCS and
values as reported
from Eq. 2. According to its definition also this parameter
ranges between 0 and 1. To set a criteria to select the applicable
techniques, some literature works were taken into account. For
the accuracy or repeatability of the experiments, Richards and
Reddy (2010) claimed that a standard deviation of 10 % was not
unheard of in geotechnical testing. Al-Tabbaa et al. (2012) also
reported an error of 5 – 15% for laboratory mixed specimens
tested with unconfined compression tests. Therefore even for
the
E
parameter the acceptable limit was set equal to 10% of
E
.
(2)
The results obtained from the specimens molded by the
Rodding technique in terms of
E
vs. torque values are shown in
Figure 2 as example. It can be clearly seen that also for the
E
parameter all the obtained values are below the set limit,
expression once again of the high repeatability of the tests
results obtained from the specimens molded by the Rodding
technique.
In order to take into account the different aspects of a well
made specimen, expressed by the
N
and
E
parameter, an index
of applicability
I
A
defined in Eq. 3 was introduced.
(3)
According to the Eq. 3 and to the
N
and
E
parameters
definitions, also the
I
A
values range between 0 and 1. To obtain
a target value for the choice of the applicable techniques, the
limit values given for the two different parameters
N
and
E
were
introduced in the Eq. 3. A target value of
I
A
= 0.82 was then
obtained.
The Figure 3 shows an example of the
I
A
vs. mixtures
workability graph obtained for all the analyzed soil-binder
mixtures molded by the Rodding technique.
0.0
0.2
0.4
0.6
0.8
1.0
0.0
6.0
12.0
18.0
Applicability index, I
A
mixture's workability - Torque,
Mt
(Nm)
KC SD
SS
SG PC
BP
RP
AT
limit
RODDING
28 days
Figure 3. Applicability index of Rodding technique.
The figure show that Rodding is applicable for all the
measured mixtures workability since
I
A
values are all above the
set target limit. From the results it is possible to see a very good
trend of the
I
A
despite the fact that data were obtained from
mixtures based on different types of soil (cohesive and granular
types), with different grout dosage and water contents. The
results obtained also from other techniques show that the
I
A
is
strictly dependent on the workability of the mixture among
other factors.
The results related to the No Compaction technique are
shown in Figure 4. It clearly appears that this technique is
applicable for
M
t
< 3Nm and not applicable for
M
t
> 6Nm. In
the range
M
t
= 3÷6Nm it is not possible to obtain univocal
indication from the data, therefore this technique have been
considered marginally applicable in this workability interval.
0.0
0.2
0.4
0.6
0.8
1.0
0.0
6.0
12.0
18.0
Applicability index, I
A
mixture's workability - Torque,
Mt
(Nm)
KC
SD
SS
SG PC
BP
RP
AT
limit
NO COMPACTION
28 days
Figure 4. Applicability index of No Compaction technique.
Similar graphs to the ones shown in Figures 3 and 4 were
also obtained for the other molding techniques used in the
study. From these graphs it was possible to determine for each
molding technique the ranges of workability in which they are


