2451
Technical Committee 211 /
Comité technique 211
h
w
h
w s
e
s
h
s
s
e
e
T
z lz
n
k
k
r r
s r
k
k r r
r
r r
r
tzrv
8 exp
21
2
ln
2
ln
1 , ,
2
2
2
2
2
2
2
2
2
for
(
e
s
r r r
)(17)
where:
n
=
r
e
/
r
w
,
s
=
r
s
/
r
w
,
k
h
and
k
s
= the hydraulic
conductivities in the horizontal direction of the undisturbed
zone and the smear zone respectively,
k
w
= the hydraulic
conductivity of the drain (PVD),
l
= the drainage length of a
PVD, and
T
h
=
c
v
·
t
/(4
r
e
2
). Parameter
μ
represents the effects of
PVD spacing, smear zone and well resistance. Adopting an
average well resistance and with some approximation, the
expression for
μ
is as follows (Hansbo 1981):
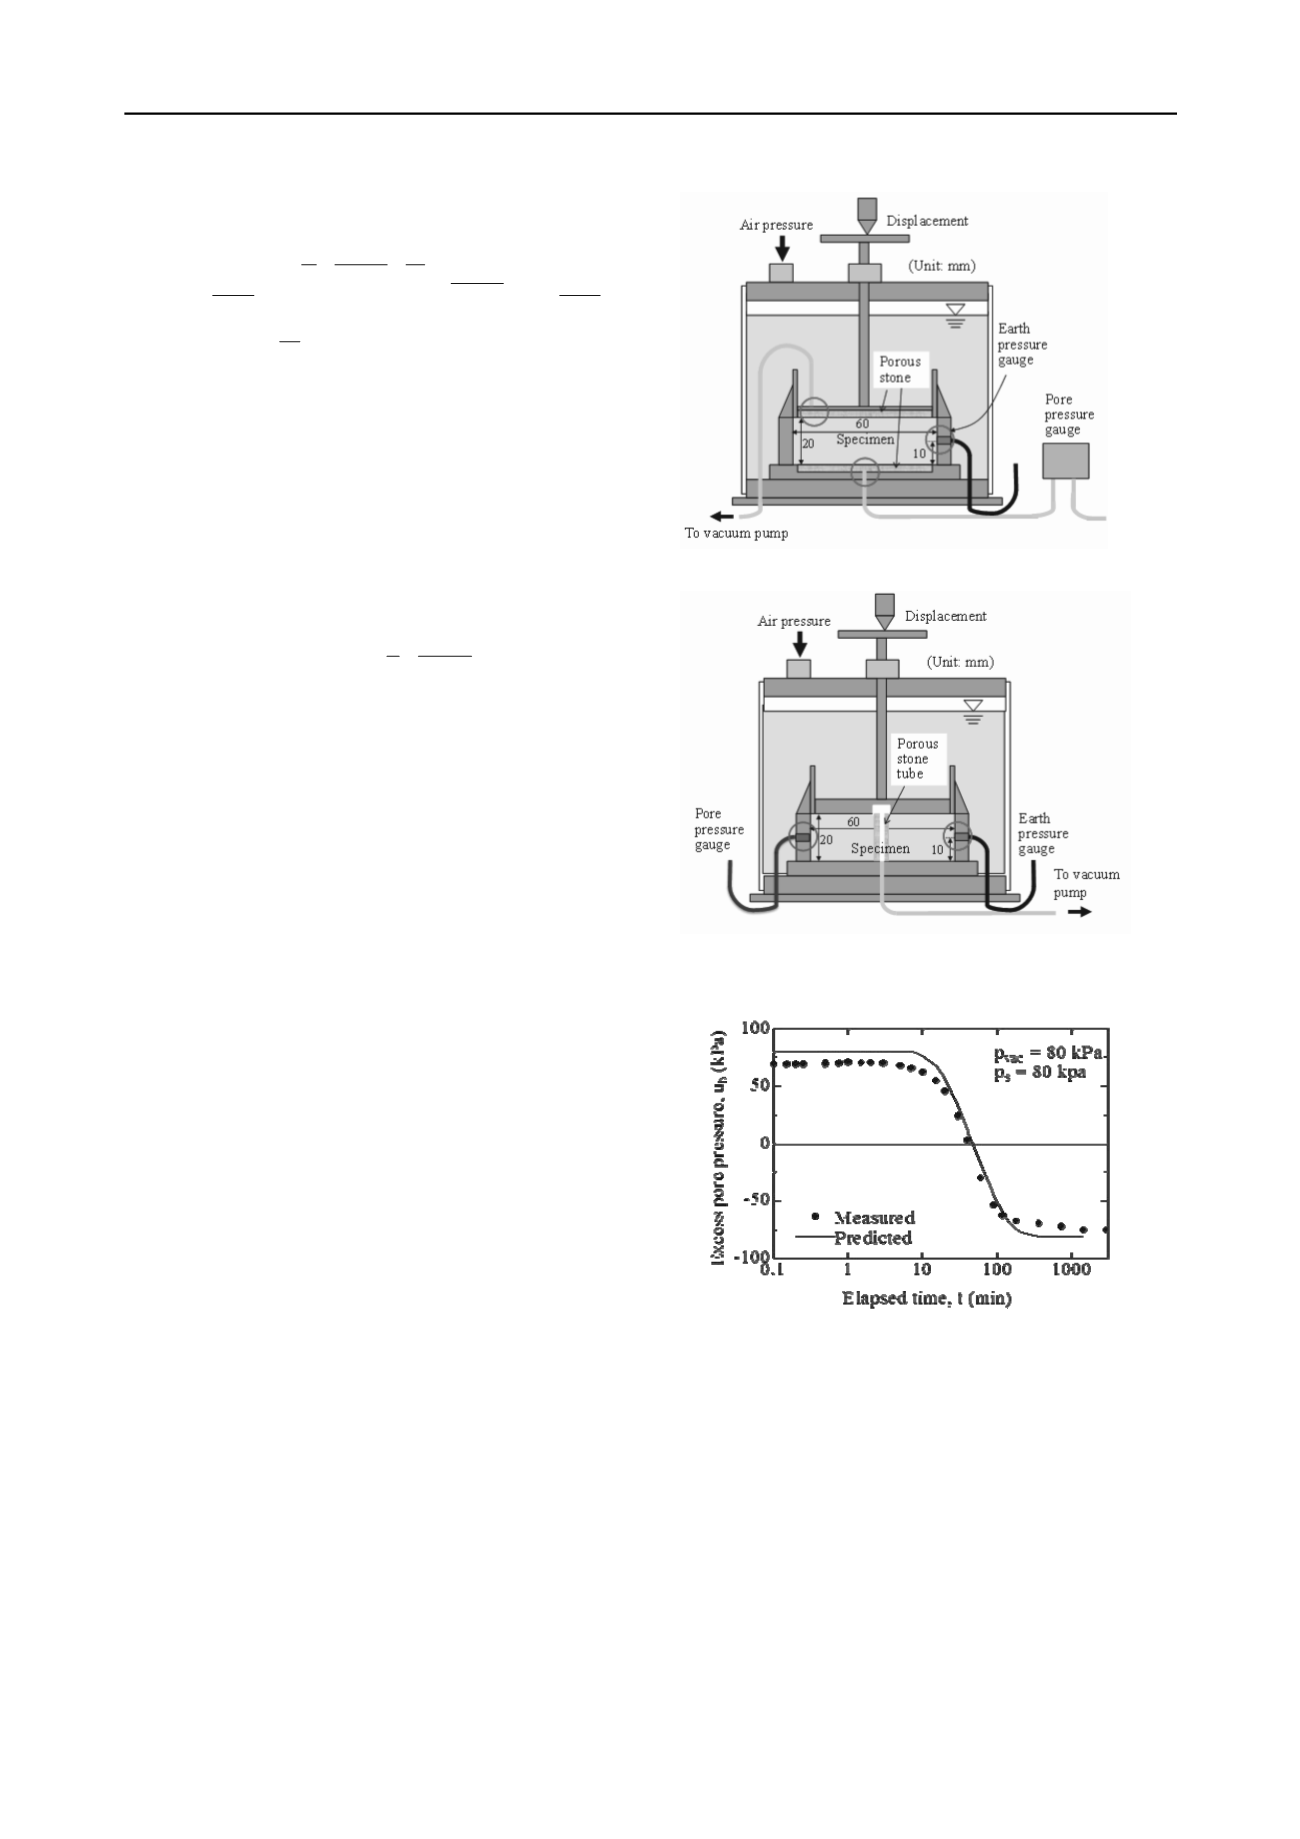
(a) Vertical drainage test
ww
h
s
h
kr
k l
s k k sn
2
2
3
2
4
3 ) ln( ) / ( )/
ln(
(18)
The average degree of consolidation (
U
h
) of the unit cell is
(Hansbo 1981):
/ 8 exp 1
h
h
T
U
(19)
3 COMPARISON OF TEST RESULTS AND PREDICTIONS
Laboratory consolidation tests involving the combination of a
vacuum pressure and a surcharge load have been conducted
under oedometer conditions with both verticaland radial
drainage (the latter to simulate the effects of PVD drainage),
and the measured excess pore pressures have been compared
with the predicted values.
(b) Radial drainage test
Figure 2. Sketch of the set-up of the te
sts
3.1
Test details
Figures 2(a) and (b) show the set-up of the tests, with vertical
(V-test) and radial (R-test) drainage conditions,respectively.
During testing, the settlement, the excess pore water pressure at
the bottom of the sample (V-test) or the middle height of the
consolidation ring (R-test), and the horizontal earth pressure at
the middle height of the consolidation ring can be measured.
For the R-test, the centre drainage porous stone tube has an
outer diameter of 8 mm, which is inserted into a predrilled hole
at the center of a sample with a filter paper placed between the
soil sample and the tube. The soil samples were re-consolidated
from Ariakeclay slurries under a surcharge pressure of 20 kPa.
Two series of tests, V-tests and R-tests, were conducted.
Here only one test from each serieshas been chosen to compare
with the values predicted by the theory presented above. In the
case of the V-test, the test with one-way drainage conditions has
been selected, because for two-way drainage conditions no pore
water pressures were measured with the device used. The two
series of tests were conducted at different times and different
soil samples were used. Some of available soil properties as
well as the test conditions are listed in Table 1. In this table, the
vertical effective stress,
σ'
v
0
, indicates that the soil sample was
first consolidated under
σ'
v
0
(simulating the initial effective
stress of the soil sample at a specified depth in the deposit) and
then the consolidation test was conducted by applying
additional incremental consolidation pressures (vacuum
pressure and surcharge load).
Figure 3. Comparison of predicted and measured
u
b
values
3.2
Comparison of measured and predicted pore pressures
3.2.1
V-test
After initial consolidation under
σ'
v
0
= 40 kPa, the thickness of
the sample was 18.7 mm (or compression of about 1.2 mm).
Further, under 80 kPa vacuum pressure and 80 kPa surcharge
load, the additional compression was about 3.2 mm. Since the
thickness of the sample is also the vertical drainage path length,
in the predictions an average sample thickness of 17.2 mm was
adopted. Comparison of the measured and the predicted excess
pore water pressures at the bottom of the sample (
u
b
) is shown


