2434
Proceedings of the 18
th
International Conference on Soil Mechanics and Geotechnical Engineering, Paris 2013
been developed. Methods are divided into two wide categories
(Schlosser 1997):
-
physical methods – soil improvement technologies, by which
soil structure is mainly improved in what concerns contacts
between particles by additives or by reducing porosity in
order to increase the tamping state - physical characteristics
improvement methods;
-
mechanical methods – soil reinforcing technologies, by
which structural elements are introduced in the ground in
order to increase the mechanical strength – mechanical
characteristics improvement methods.
Classification of results sought by difficult foundation soil
improvement (Kirsch, Sondermann 2003):
-
increasing density and shearing strength
-
reducing compressibility
-
influencing permeability in order to reduce infiltrated water
flow or to speed up consolidation process
-
improving homogeneity.
3
LABORATORY TESTS
In the experimental programme, various mixtures of loessoid
material with different natural mineral materials have been
proposed, in view of eliminating moisture sensitiveness,
improving geotechnical parameters of mechanical behaviour
and limiting permeability (Burlacu 2012).
To this purpose, a series of mixtures have been proposed:
loess with sand 1-2 mm (Cu = 1.5) and loess with sand and
bentonite powder addition in two variants of mixture. The
obtained mixtures are presented below:
Mixture 1: 80% loess + 20% sand (1-2 mm);
Mixture 2: 60% loess + 40% sand (1-2 mm);
Mixture 3: 50% loess + 40% sand (1-2 mm) + 10%
bentonite;
Mixture 4: 50% loess + mixture from (40% sand (1-2 mm) +
10% bentonite);
The difference between the last two mixtures consisted in the
way they were mixed. In the first case, all the three materials
were simultaneously mixed and then water was added to reach
different degrees of humidity in order to perform the normal
Proctor test. In case of the last mixture, the sand was first mixed
with the bentonite and with water and then, after this mixture
had dried, it was also mixed with the loess (Olinic 2012).
As a first step, the optimal compaction characteristics of the
proposed mixtures were determined and then, based on the
compacted samples, the compressibility and shearing
mechanical characteristics and the possible moisture-sensitivity
of the compacted material were determined. The samples used
for carrying out the mechanical tests were the ones surrounding
the optimum compacted sample. In order to reach uniform
results, the variation of the density in dry condition depending
on the height of the compacted sample was analyzed and
confirmed (Figure 2). This is why a certain sampling order was
followed.
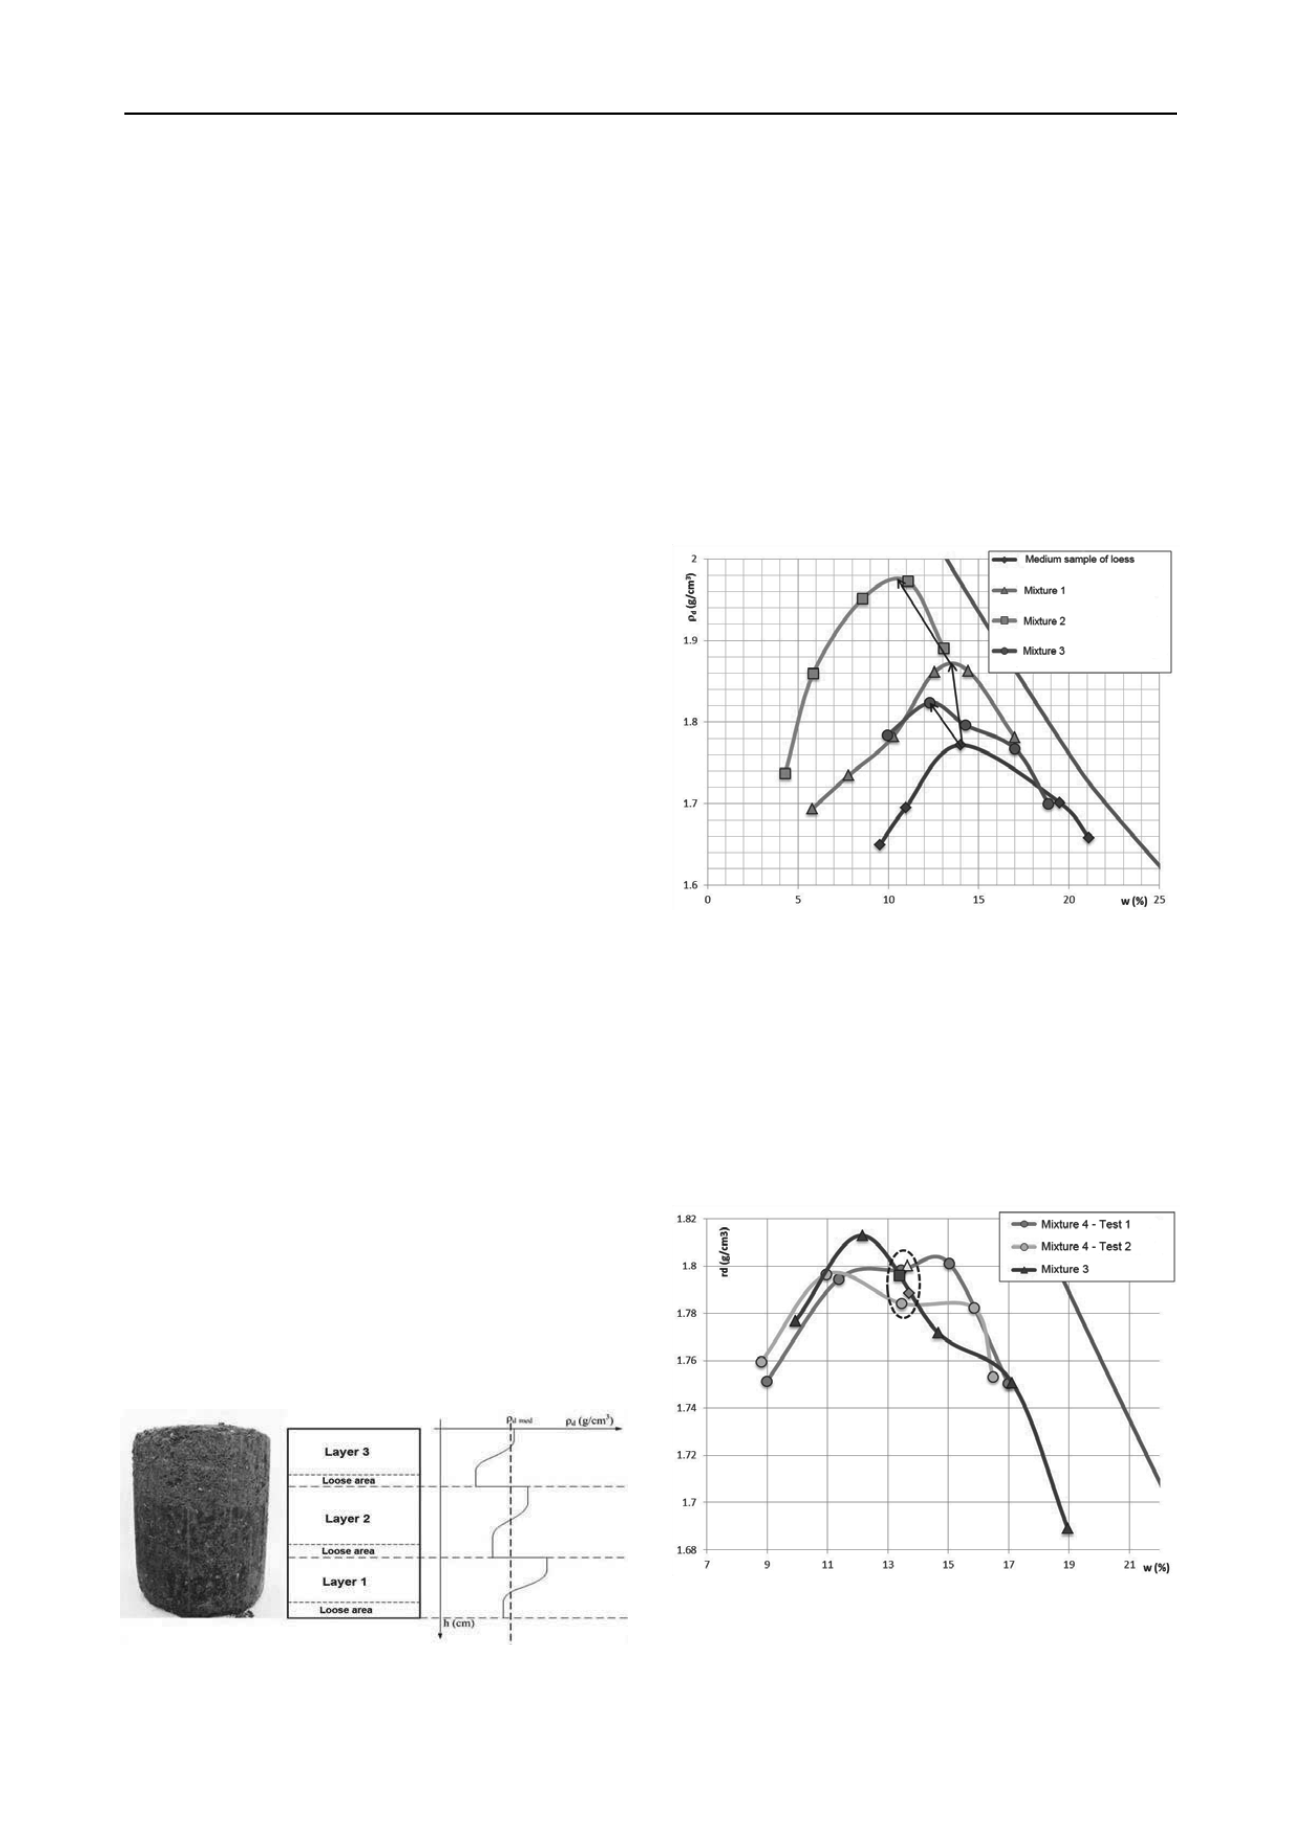
Figure 2. Dry density teoretical variation depending on the height of the
compacted sample.
As a result of the Proctor test outcome analysis (Figure 3), it
has been observed that along with adding up and increasing the
percentage of sand in the mixture (from 20% to 40%), the
maximum density in dry condition increases. At the same time,
the optimal compaction moisture of the mixtures decreases
The synthesis of the oedometre compressibility tests
depending on the oedometric moduli values indicated that the
same values E
oed 200-300
could be obtained for the mixture
containing an addition of sand of 20%, at smaller humidity
values and at a better tamping state than in case of the natural
loess samples. This trend disappeared once the percentage of
sand in the mixture was increased (40%). In what concerns
samples with bentonite, similar values of oedometric moduli
were obtained at a better tamping state that in case of medium
loess samples, but at a reduced tamping state than in case of
samples with sand, which was also confirmed by the values
obtained following Proctor tests.
Figure 3. the results of the Proctor trial for all the mixtures obtained.
If, in case of mixture 3, the Proctor diagram has a maximum
point (
dmax
, w
opt
), in case of mixture 4, the same tamping state
was obtained for humidity values between 11% and 15%.
The Proctor diagram resulted for mixture 4 indicated that
sample 3 could have represented a maximum point. Therefore,
in order to validate the results, tests on this sample were carried
out again and similar values were obtained (Figure 4). Given
that, humidity plays a key role in the real scale compaction
process, the last indication regarding mixture 4 is important
because it allows compaction at humidity values belonging to
higher humidity domains.
Figure 4. Results of Proctor test for mixtures 3 and 4.
As to the values of the permeability coefficient, these have
been of the order of 10
-5
cm/s for the average loess sample
rising up to values of 10
-4
cm/s in case of the mixture containing
40% sand, while in case of the mixtures containing an addition
of bentonite, the measured values were below 10
-9
cm/s.


