2341
Technical Committee 209 /
Comité technique 209
The aforementioned patterns of behavior shown in Fig. 4 can
also be found in other tests with SLR of different values. The
accumulated displacement for each test fell qualitatively into
any of the three distinct patterns shown in Fig. 4:
(1) no accumulated displacement, as exhibited during the test
with CLR of 0.1;
(2) continuing displacement, as exhibited during the tests
with CLR ranging from 0.2 to 0.5;
(3) failure, as exhibited during the test with CLR of 0.6.
For the first case, the pile-soil system seems not to be
influenced by the cyclic loading and is in elastic range; only
small accumulated displacement was produced during the first
few cycles. For the second case, the pile-soil system was
influenced to some degree and partially entered plastic range;
the pile head showed continuing downward movement without
any apparent limit and the accumulation of displacement
depended on both of cyclic load level and number of load cycles,
and high cyclic load level and large number of cycles produced
larger permanent displacement. For the last case, the cyclic
loading had brought severe damage to the pile-soil system and
the pile fully entered the plastic range; the pile head moved
continuously downward at a rapid rate up to the end of the test
and a plunging failure might occur in some cases.
Thus, to divide the accumulated displacement responses for
the tests with a given SLR two critical values of CLR are
defined here, named minimum cyclic load ratio (MCLR) and
failure cyclic load ratio (FCLR), respectively. For CLR smaller
than the MCLR, the pile was in elastic range; for CLR greater
than the FCLR, the damage to the pile-soil system was severe
and the always caused “failure”.
The MCLR was found to be of 0.1 in all the tests and shown
to be unaffected by the SLR, and it can be inferred that if the
applied cyclic loads remained less than 10% of the ultimate pile
static capacity, the response of the pile can be considered to be
total elastic and the permanent displacement was negligible
after first several cycles.
The FCLR was found to be of 0.5 for the tests with SLR
ranging from 0.2 to 0.4. However, in the case of the test with
SLR of 0.1, the pile produced large permanent displacement
with CLR of 0.4, and it showed the tendency that lesser cyclic
loads were required to cause large permanent displacement for
the pile with very small SLR. Briaud and Felio (1986) reviewed
the previous cyclic load tests and concluded that a threshold of
peak load ratio (CLR+SLR) existed above which large
permanent displacement occurred and the value of that
threshold was about 0.8 on average. However, the tests results
suggest that the large permanent displacement depended more
on the magnitude of the cyclic load rather than the peak cyclic
load. It can be inferred from the results that large permanent
displacement occurred if the magnitude of the applied cyclic
load exceeds the 50% of the ultimate pile static capacity.
3.2 Prediction method
To investigate the evolution of the permanent displacement in
the tests in which the permanent displacement are identified as
“continuing displacement”, the results are replotted on double
logarithmic scales and the evolution of the permanent
displacement is evaluated in terms of the dimensionless ratio
0
( )
N
s
s
s N s s
s
s
(3)
which expresses the magnitude of the permanent displacement
( )
s N
caused by cyclic loading in terms of the displacement
s
s
that would occur in a static load test when the load is equivalent
to the maximum cyclic load (as defined by
(
)
u
SLR CLR P
).
The
0
s
and
N
s
refer to the permanent displacement in first and
N’
th cycle, respectively.
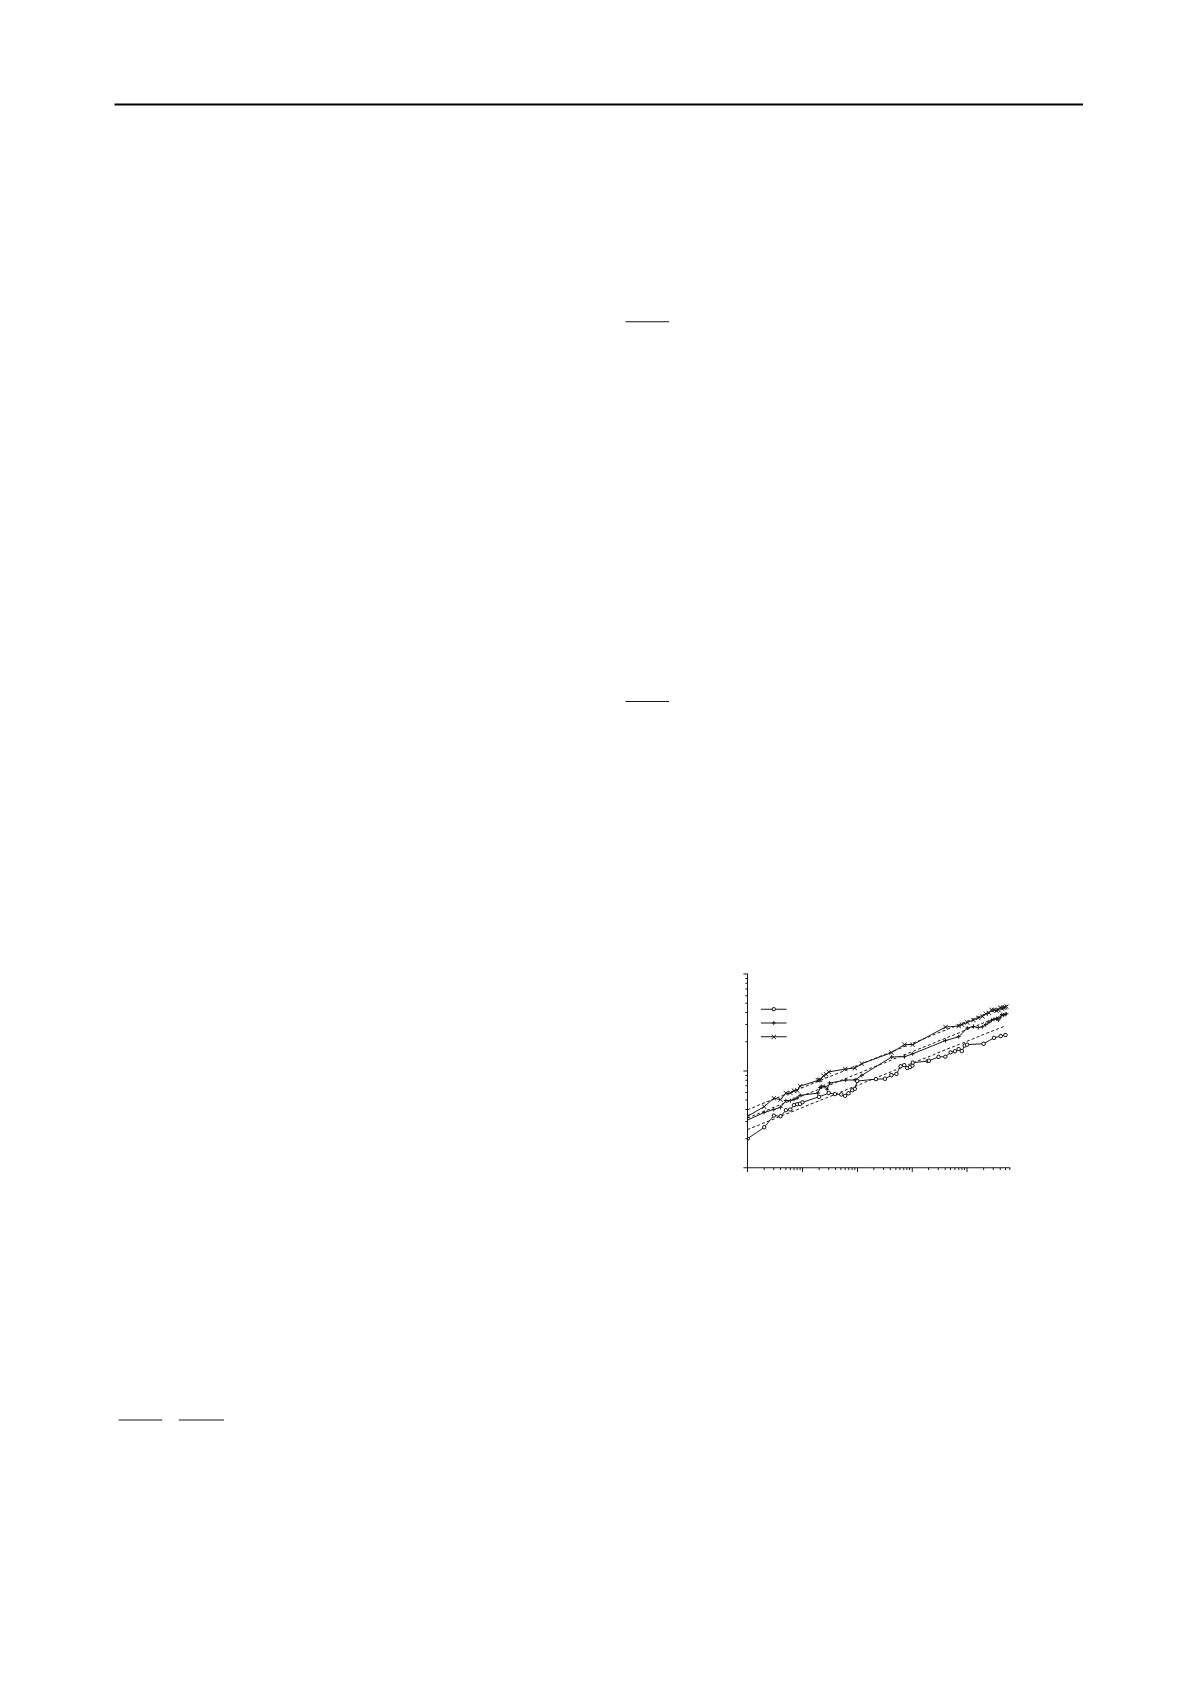
The results, plotted in Fig. 5, show that the trend in the data
follows the exponential behavior which appears as straight lines
in double logarithmic axes. This suggests that the permanent
displacement due to cyclic loading can be predicted by the
following power model:
( )
b
s
s N AN
s
(4)
where
A
and
b
are two parameters. It is observed in Fig. 5 that
all slopes are almost equal. This suggests that
b
is independent
of the load characteristics within the observed range. It is
introduced into (4) to represent the influence of load
characteristics on parameter in the following form:
(
1) (
)
m
n
A a SLR CLR
(5)
where
a
,
m
and
n
are three calibration parameters. Clearly,
when
0
CLR
, then
0
A
and no accumulated displacement
will occur under static load. Also, when
0
SLR
then
(
)
n
A a CLR
indicates that the accumulated displacement
depends only on CLR. Thus, substituting (5) into (4) gives the
following model for accumulated permanent displacement:
( ) (
1) (
)
m
n b
s
s N a SLR CLR N
s
(6)
The expression in Equation (6) was fitted to the data in Fig.
5 to empirically determine values of these parameters and back-
calculated parameters
a
,
m
,
n
and
b
for the tests are 0.054,
0.68, 1.24 and 0.23. The predicted results are shown by the
dotted lines in Fig. 5 and it appears that the influences of the
load characteristics on permanent displacement are reflected
well in the prediction. The closeness of the fit up to
4
5 10
cycles indicates that, in the absence of further experimental data,
it might be reasonable to extrapolate beyond
4
5 10
N
. Further
data are, of course, required to confirm this hypothesis.
10
0
10
1
10
2
10
3
10
4
0.01
0.1
1
SLR=0.3
s / s
s
N
Experimental:
CLR=0.2
CLR=0.3
CLR=0.4
Figure 5. Measured and predicted accumulated displacement
The dotted lines are obtained using Equation (6)
4 CYCLIC DEFORMATION DIAGRAM
Poulos (1988) proposed the idea of cyclic stability diagram to
investigate the capacity degradation caused by cyclic loading. In
this study, similar concept is used and the idea of a diagram
named cyclic deformation diagram is developed. The cyclic
defromation diagram for the model piles is shown in Fig. 6. In
the diagram, the aforementioned three types of displacement
response are represented by different symbols. Therefore, three
main regions can be identified on the diagram shown in Fig. 6:
(1) A stable (elastic) region I in which the cyclic loading
has no influence on the pile responses and the displacement
response is the type of “no accumulated displacement”.


