2340
Proceedings of the 18
th
International Conference on Soil Mechanics and Geotechnical Engineering, Paris 2013
Figure 1. The big soil tank at Zhejiang University
Table 1. Main soil properties
Property
Value
D
50
particle size (mm)
0.032
Specific gravity,
G
S
2.69
Plastic limit,
W
L
22.6
Liquid limit,
I
L
Plasticity index, PI
31.7
9.1
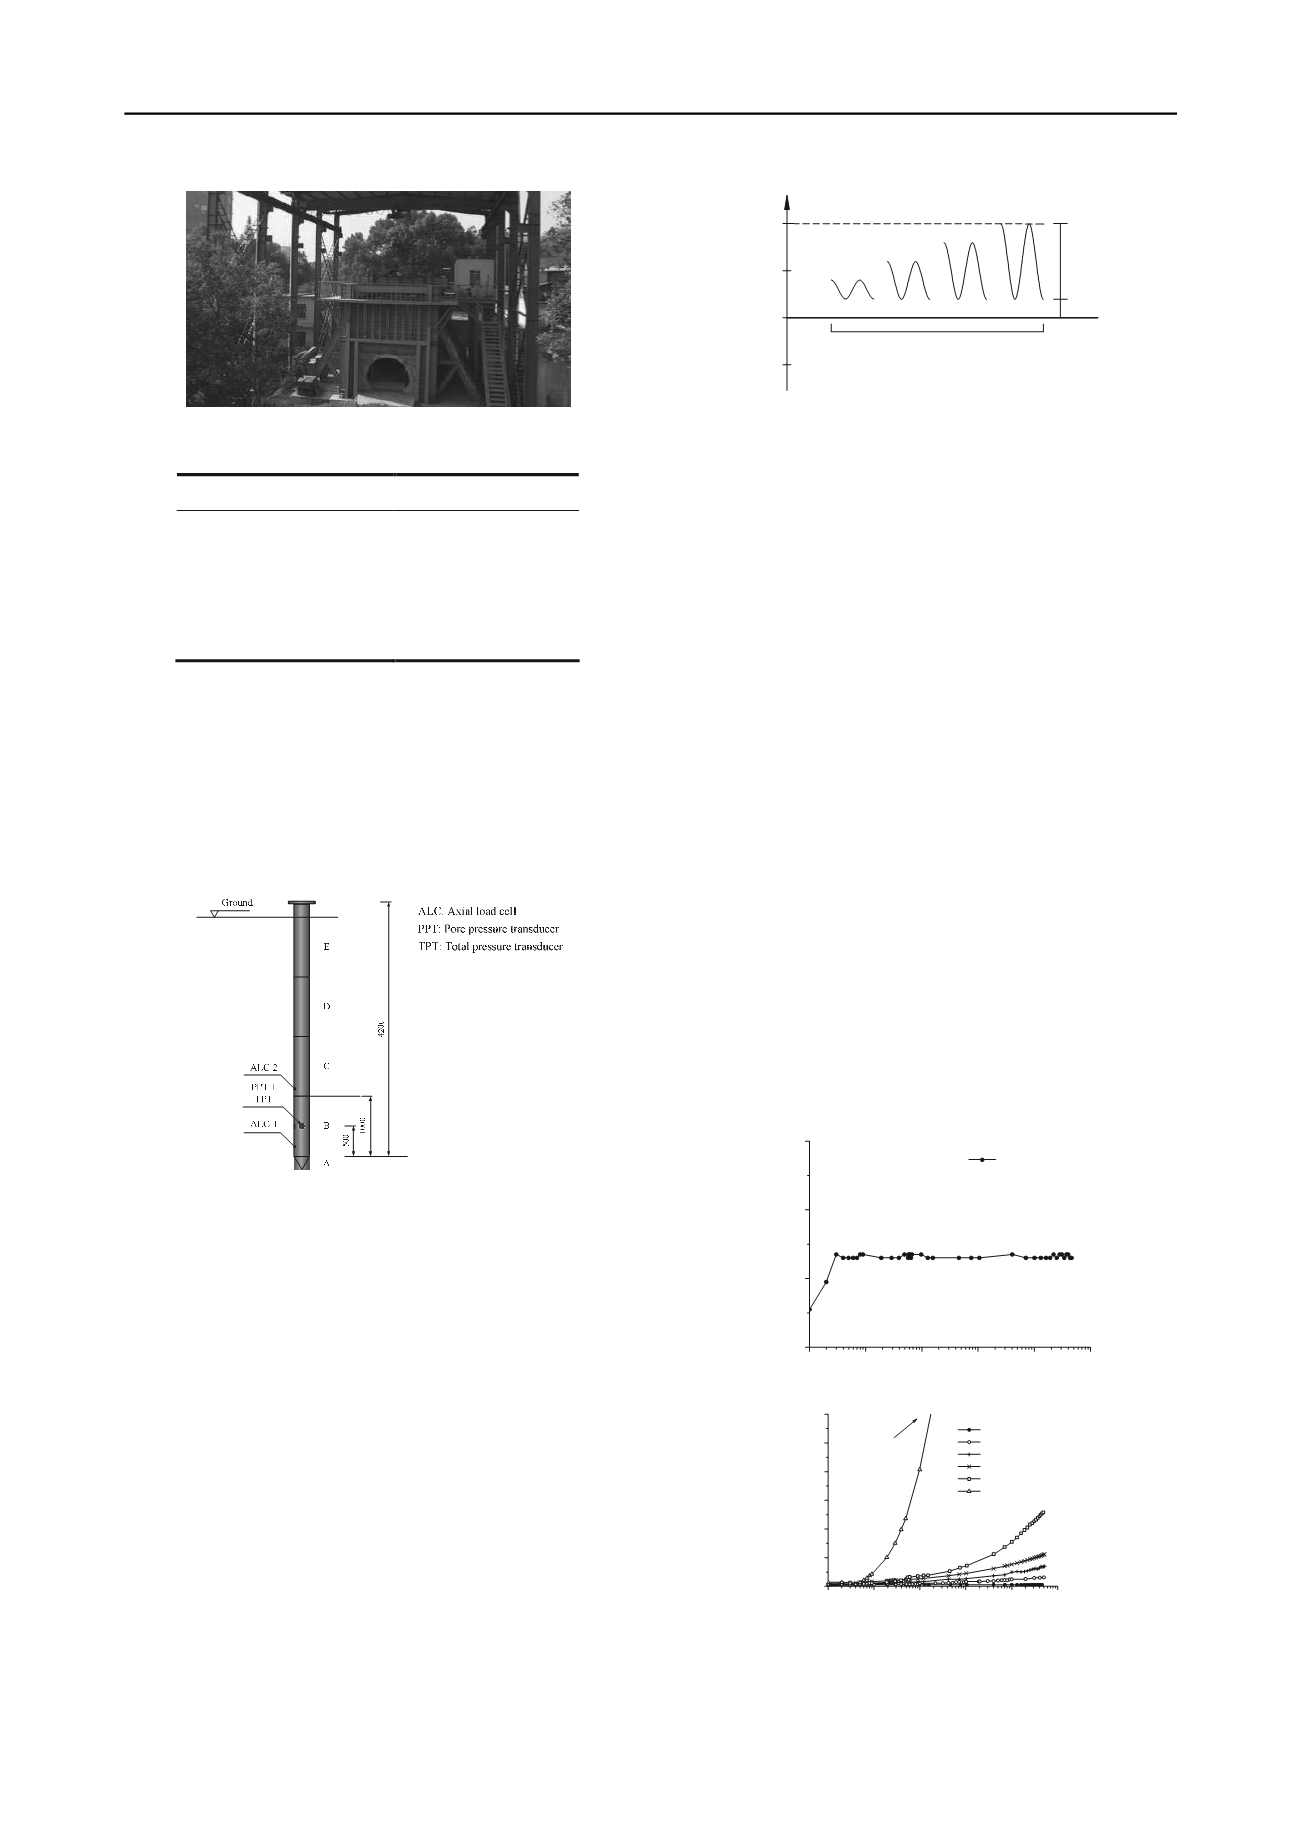
2.2 Model pile
The used instrumented model pile was closed-ended steel tube
pile with an outer diameter (
d
) of 168 mm, a wall thickness of 7
mm. The pile had a cone-shaped tip end with a cone angle of
60
o
. The model pile was designed to be assembled from four
segments to give a full length of 4.2 m. The instrumentation
consisted of axial load cells (ALC), total pressure transducers
(TPT) and pore pressure transducers (PPT).
Figure 2. Schematic diagram of the model pile (Unit: mm)
2.3 Characteristics of cyclic loading
The characteristics of the applied cyclic load are uniquely
defined using two independent parameters:
/
s
u
SLR P P
(1)
/
c u
CLR P P
(2)
in which
u
P
refers to the static ultimate capacity of the pile in
compression, and
s
P
is the minimum in a load cycle and
c
P
is
the cyclic load amplitude. In present study,
s
P
and
c
P
simulated
the self-weight from the superstructure and the cyclic load
induced by the high-speed trains, respectively. A visual
interpretation of the load ratios is given in Fig. 3.
P
U
P
CLR=
SLR=0.2
0.2
0.4
0.6
0.8
P
C
P
S
CLR=P
C
/P
U
SLR=P
S
/P
U
0
Figure 3. The characteristics of cyclic loading
In this study, the cyclic load frequency of 3Hz was used for
the tests and the sampling frequency was of 50 Hz.
3 TEST RESULTS
3.1 Accumulated settlement
The overall pattern of accumulated settlement of the pile with
SLR of 0.3 is presented in Fig. 4 by normalizing the
accumulated permanent displacement
s
by the pile diameter
d
.
The values of the CLR in this series ranged from 0.1 to 0.6. It
can be found that the ways in which displacement developed is
highly dependent on the amplitudes of cyclic load which can be
represented by the cyclic load ratio (CLR).
In the test with the smallest CLR of 0.1, extreme small
permanent displacement, of approximately 0.04%
d
was
produced in the first three cycles and remained nearly constant
from cycle No. 3 to 50,000. For the CLRs ranging from 0.2 to
0.5, the permanent accumulated displacement increased
gradually with the increasing number of cycles and also with
the increasing magnitude of cyclic load. For the tests with the
CLR of 0.2, 0.3, 0.4 and 0.5, the permanent displacements at the
end of the tests were 0.15%
d
, 0.35%
d
, 0.56%
d
and 1.26%
d
,
respectively. The permanent displacement increased rapidly at
initial stage and had the highest rate of displacement increase in
the first few cycles, and then it kept increasing continuously
with a decreased rate of displacement increase and seemed to
increase without a final and constant value. For the test with
very large cyclic load, such as CLR=0.6, the pile head moved
downward in a very “unstable” way marked by a quick plunging
during the test and the pile failed with a total accumulated
displacement of 10%d in 2,147 cycles.
10
0
10
1
10
2
10
3
10
4
10
5
0.00
0.02
0.04
0.06
s / d (%)
N
CLR=0.1
SLR=0.3
(a). CLR=0.1
10
0
10
1
10
2
10
3
10
4
10
5
0.0
0.5
1.0
1.5
2.0
2.5
3.0
s / d (%)
N
CLR=0.1
CLR=0.2
CLR=0.3
CLR=0.4
CLR=0.5
CLR=0.6
SLR=0.3
s=10%d after
2174 cycles
(b). CLR=0.1~0.6
Figure 4. Normalized permanent displacement (s/d) with number of
cycles (SLR=0.3)


