2203
Technical Committee 208 /
Comité technique 208
Table 1. Parameters adopted in the numerical study
Parameter
Magnitude
Slope angle
35
0
Baffle dimension
0.2m x 0.2m x 1m
Particle diameter
0.05m
Density of each particle
2650kg/m
3
Particle and wall stiffness
1x10
8
(unit)
Contact friction angle
35
0
Coefficient of restitution
0.5
Rolling friction coefficient
0.7
Approaching velocity
8m/s
3 COMPUTED RESULTS
3.1
Flow Profile
Figure 3 shows the plan and side view of a number of snapshots
recorded in the numerical analyses. The time difference
between each snapshot is 0.012 second. The darker the particle
colour, the lower was its velocity. A velocity reduction of the
discrete elements immediately behind the baffles was observed
on plane and Section A-A as shown in Figure 3.
In Figure 3a, at time = 0s, the particles at the front of the
flow were just in contact with the baffle. In Figure 3b, at time =
0.012s, the dark region signified the slowing down of the
discrete elements behind the baffle after impacting it. The
boundary of the dark region where the momentum of the
discrete elements was reduced by the baffle is marked by a
white dashed line.
a
b
c
d
Time =0s
Time =0.012s
Time =0.024s
Time =0.036s
The baffle
1 23
Influence zone
Region 1
Influence zone reaching the
computation boundary.
Region 2
Region 3
Frontal velocity not much reduced
A
A
Section A-A
Figure 3. The snapshots showing the change of particle velocity during
impact. The time difference between each snapshot is 0.012 second.
In Figure 3c, at time = 0.024s, the size of the dark region
increased in size, and the dark region reached the computation
boundary in Figure 3d. This indicates that the reduction of the
momentum of the discrete elements behind each baffle was no
longer localized, but a continuous zone of momentum reduction
behind the row of the baffles. The presence of such a
momentum reduction zone suggests that most discrete elements
passing through the baffles will be decelerated by the flow
resistance provided by the baffles. The only exception was the
frontal discrete elements located between the baffles. As
highlighted in Figure 3d, the velocity of the frontal discrete
elements between the baffles was not reduced by the baffles. It
is noted from the side view snapshots that the flow depth right
behind the baffle increases at the time of frontal impact. The
deceleration of the discrete elements was observed to be
uniform over the flow depth.
In order to capture and record the dynamic behaviour of the
discrete elements behind the baffles, three measurement regions
(i.e. region 1, 2 and 3) as shown in Figure 3a were established.
Each measurement region was 0.4m in length in the longitudinal
direction. The unbalanced force, kinetic energy and discharge
rate of the discrete elements within the measurement regions in
the first 0.14 seconds of the impact process were recorded and
presented as follows.
0
0.2
0.4
0.6
0.8
1
1.2
0
0.02
0.04
0.06
0.08
0.1
0.12
0.14
q
n
/ q
n
(max)
Time (s)
Region 1
Region 2
Region 3
0
0.2
0.4
0.6
0.8
1
1.2
0
0.02
0.04
0.06
0.08
0.1
0.12
0.14
K
e
/ K
e
(max)
Time (s)
Region 1
Region 2
Region 3
0
0.2
0.4
0.6
0.8
1
1.2
0
0.02
0.04
0.06
0.08
0.1
0.12
0.14
f
x
/ f
x
(max)
Time
Region1
Region2
Region3
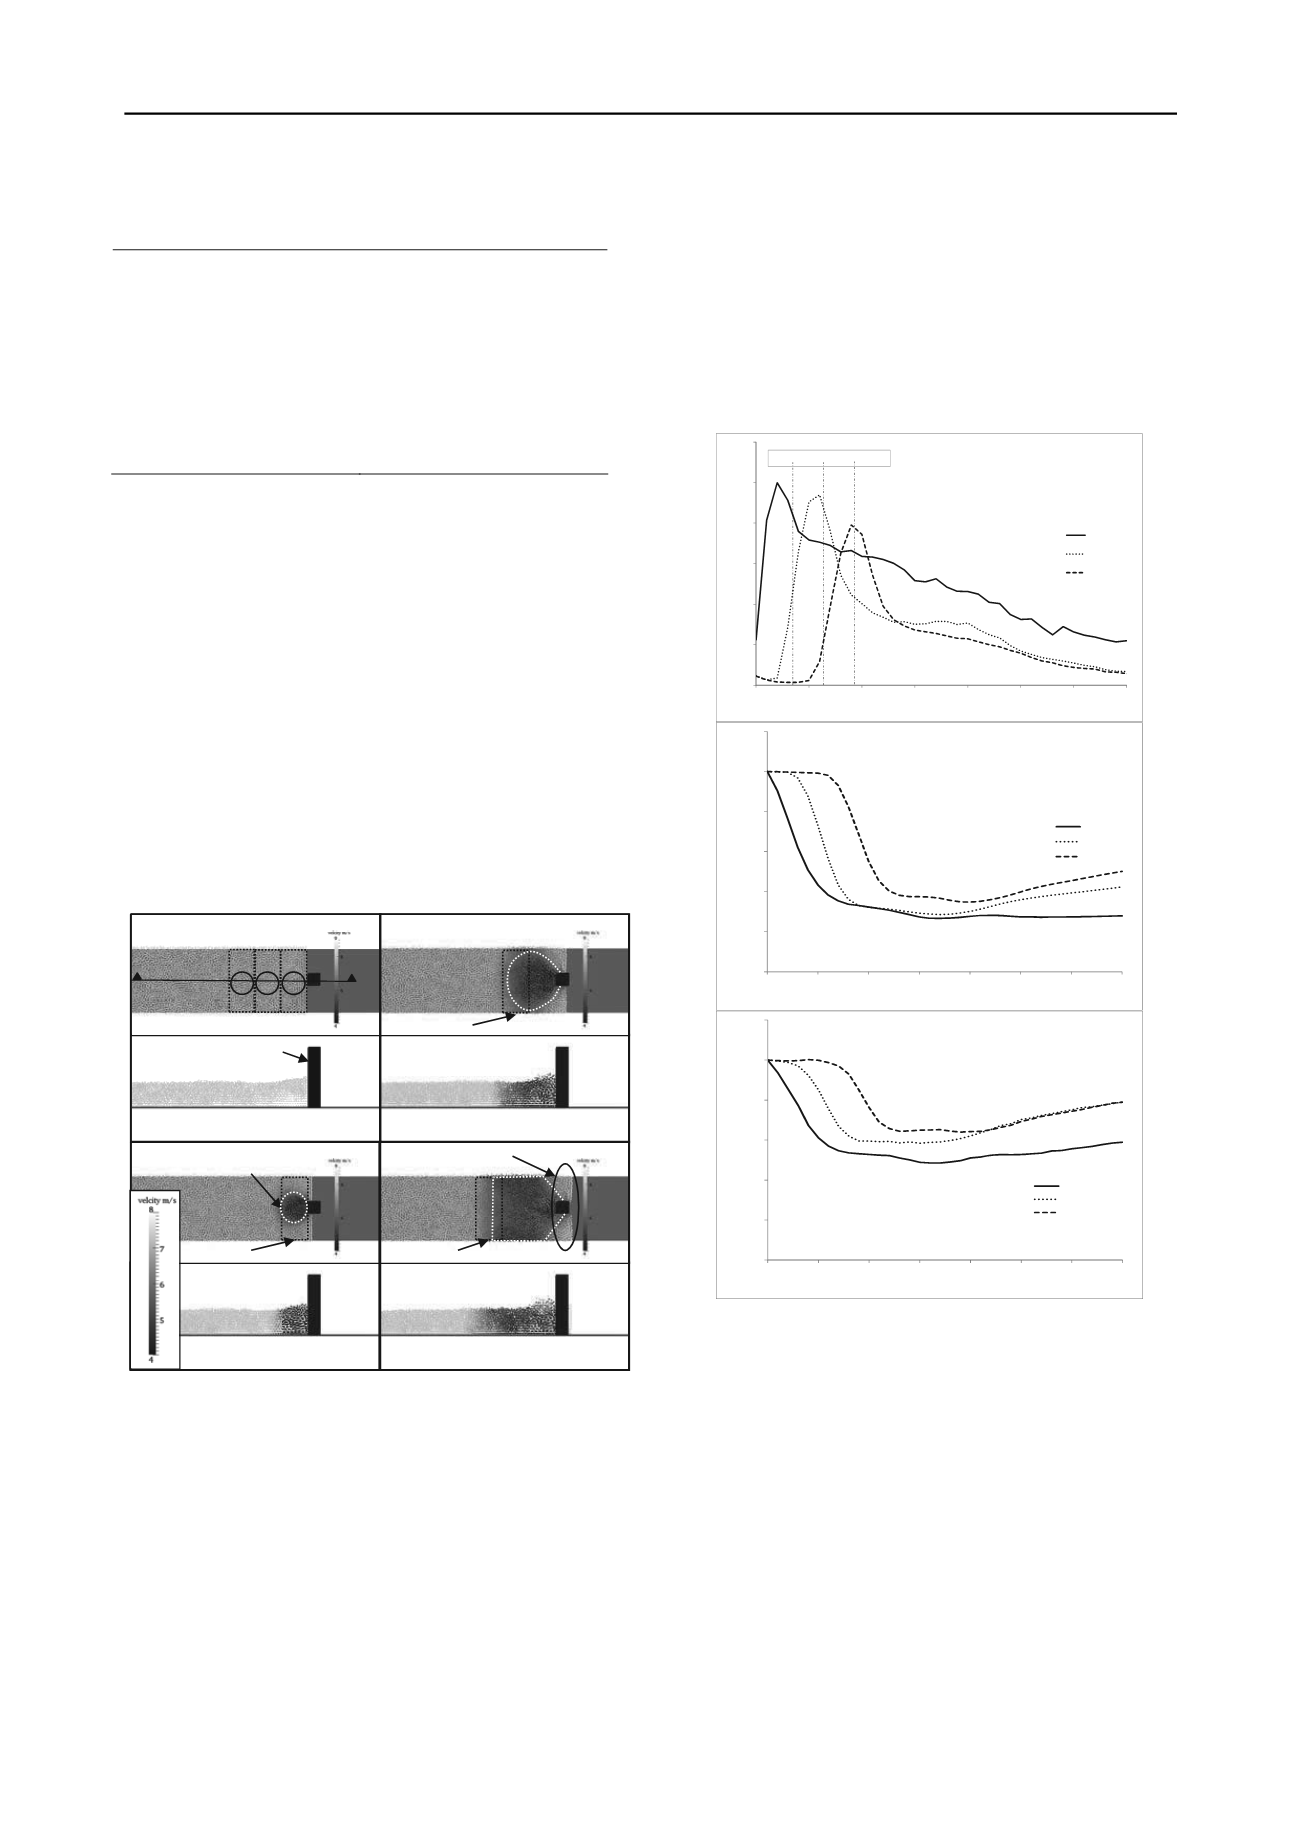
Fig. 3b 3c 3d
a
b
c
Figure 4. The computed f
x
, k
e
and q
n
of discrete elements located in
region 1, 2 and 3 (please refer to Figure 3a for the location of the
regions).
3.2
Unbalanced force on discrete element close to the baffle
The unbalanced force (f
x
) is the sum of the unbalanced force of
all discrete elements in the flow direction. When the granular
flow approaches the baffles, a change in the normalized
unbalanced force (f
x
/ f
x(max)
) with time is an indication of the
internal stress experienced by the discrete elements due to the
dynamic impact on the baffles. Figure 4a shows the
relationship of (f
x
/ f
x(max)
) with time in region 1, 2 and 3. The
built up and decline of f
x
were recorded in the three
measurement regions 1, 2 and 3 and presented in Figure 4a.
From Figure 4a, the duration of the peak f
x
acting on the
baffle was less than 0.01s, and the sequential peak f
x
observed
in all the three measurement regions had indicated the
propagation of impact pulses in the opposite direction of the
flow during frontal impact of granular flow on the baffles. By
comparing Figure 3 and Figure 4a, it is observed that the


