2198
Proceedings of the 18
th
International Conference on Soil Mechanics and Geotechnical Engineering, Paris 2013
The toolbox offers a simplified option for estimating the
hazard and risk levels of the slide at hand. The user selects the
mitigation measures to be included in the assessment. The tool-
box then ranks, with built-in assessment factors and weights
and/or with user-defined ranking values and criteria, the mitiga-
tion measures included in the analysis.
The web-based toolbox does data management, generates a
report and provides help to the user, as well as a user forum.
The web-based toolbox has the following features:
Algorithm to describe a case study, estimate the expected
hazard and risk level and to rank, on an engineering
judgment basis, the mitigation measures included in an
analysis.
Data management (e.g. save data half-way in analysis, re-
turn to an earlier case, look up prepared examples or look
up in database for information on mitigation measures).
Report generation function.
User forum.
Help function.
User management, with password-protected user login.
The toolbox will probably always be in evolution, even after the
SafeLand project is completed, as it has ”dynamic” technical
contents that need to be updated as experience grows and new
information becomes available. At all times, the user has access
to the toolbox with options to Create a new case, Open a saves
case, View a case study, Save a current case, Save as, Delete a
current case , and Print.
Several modern technologies were implemented in develop-
ing the toolbox. One of them includes desktop toolbar that can
automatically be enabled, disabled or hovered to improve user-
interface. These toolbar icons of 64 x 64 pixels were designed
using graphic software.
3 DECISIONS IN TOOLBOX
3.1
Risk classes and need for mitigation
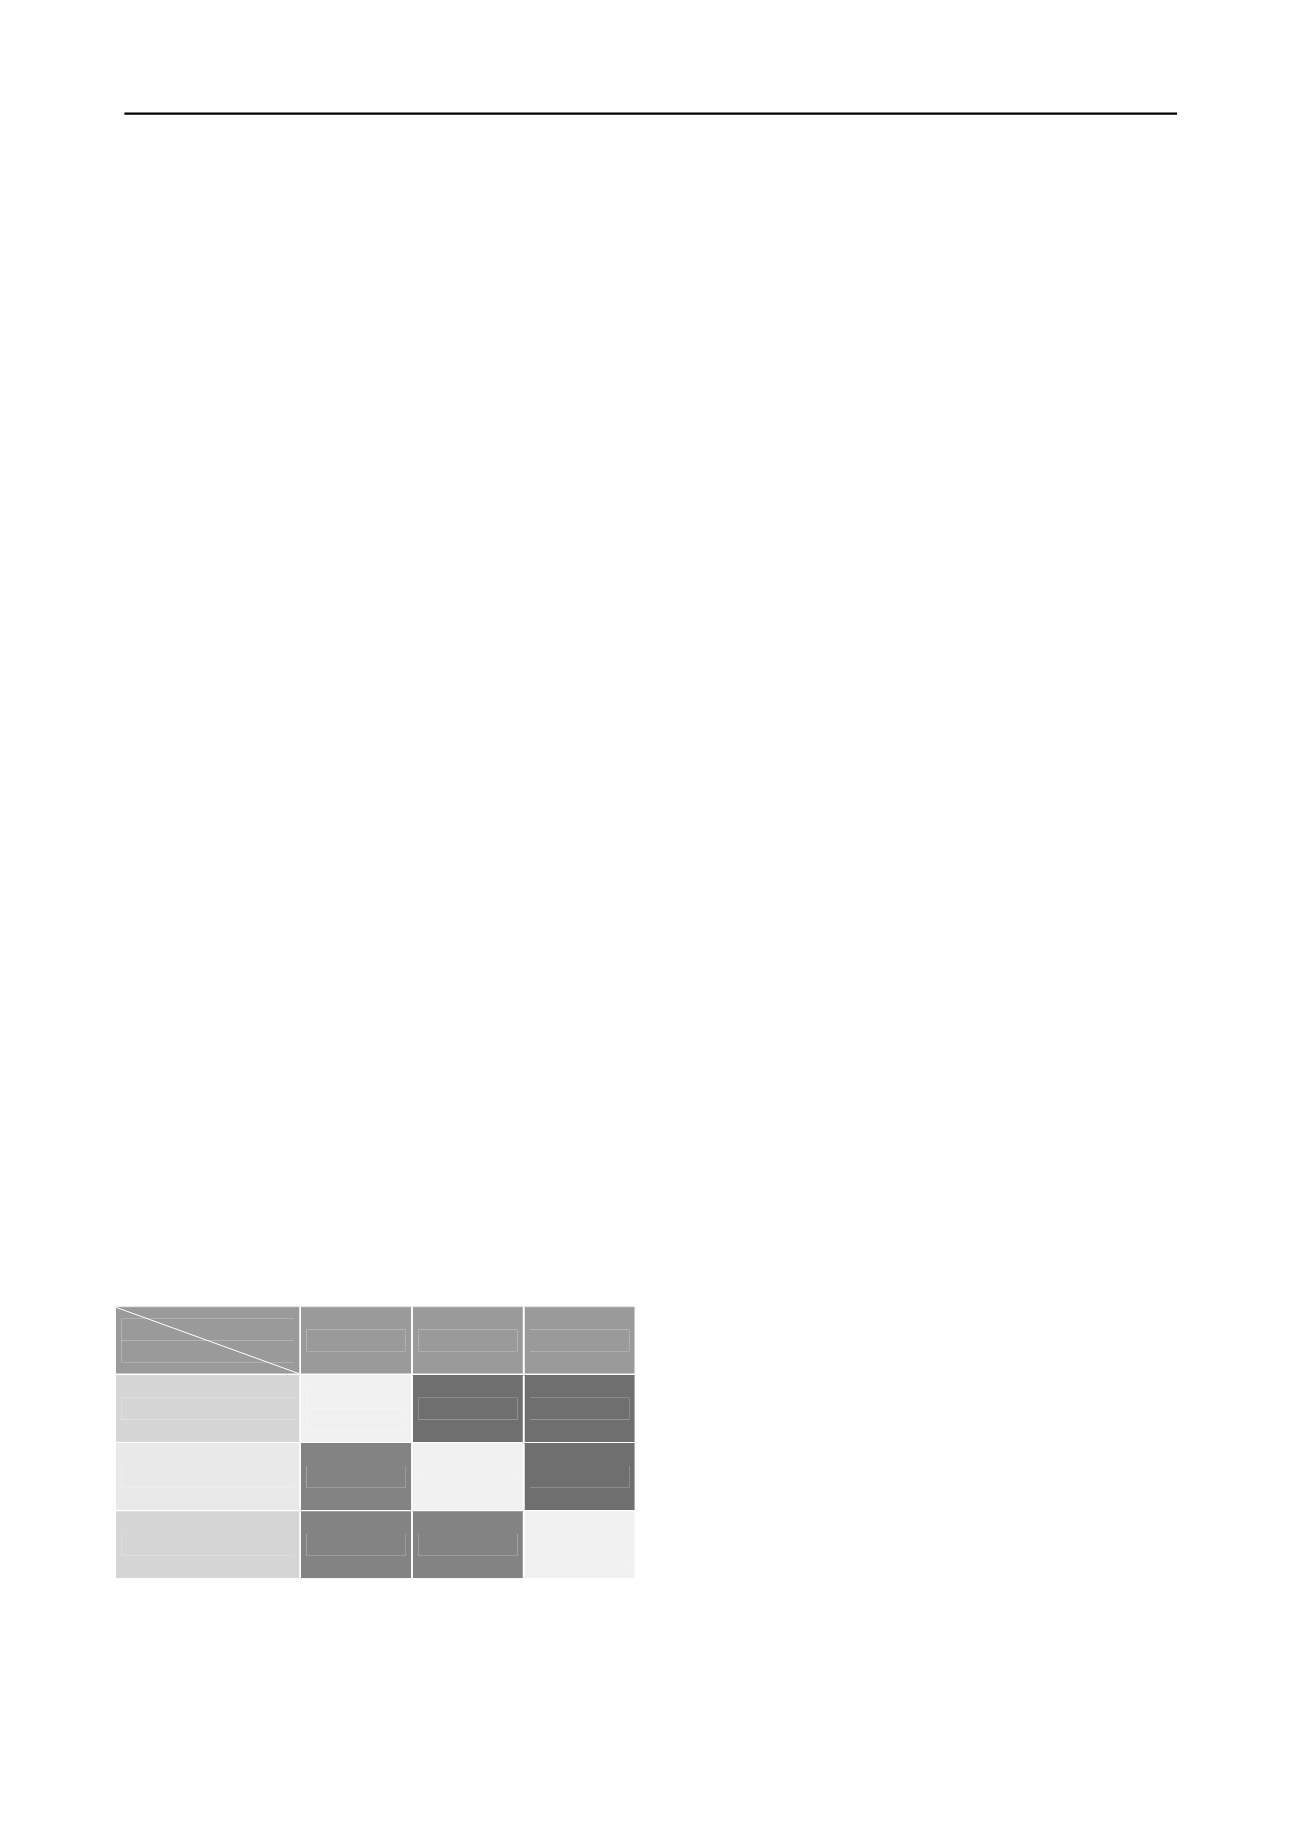
The risk classes used in the toolbox are shown in Figure 1. De-
pending on a combination of levels of consequence and hazard
selected by the user, three risk classes can be assigned by the
toolbox: Low, Medium and High. In this simplified model,
"High risk" represents an unacceptable risk that requires new
site investigations, stability calculations and mitigation meas-
ures, "Medium risk" is a risk level that requires considering do-
ing new site investigations and analyses. For "Low risk" situa-
tion, further risk reducing measures are not necessary.
Consequence
Hazard
Low
Medium High
High
Medium
Risk
High Risk
High Risk
Medium
Low Risk
Medium
Risk
High Risk
Low
Low Risk
Low Risk
Medium
Risk
Figure 1. Risk classes in Toolbox of Mitigation measures.
3.2
Ranking of measures
The selection of the most appropriate mitigation measures to be
adopted in specific situations take into account the following:
(1) the factors that affect the hazard, in terms of the type, rate,
depth and the probability of occurrence of the movement or
landslide, such as, for example:
the physical characteristics of the geo-
system, including the stratigraphy and the mechanical char-
acteristics of the materials, the hydrological (surface water)
and the hydro-geological (groundwater) regime;
the morphology of the area;
the actual or potential causative processes
affecting the geo-system, which can determine the occur-
rence of movement or landslides;
(2) the factors that affect the nature and the quantification of
risk for a given hazard, such as the presence and vulnerability of
elements at risk, both in the potentially unstable area and in the
run-out area; and (3) the factors that affect the feasibility of spe-
cific mitigation measures, such as, for example:
the phase and rate of movement at the time of imple-
mentation;
the morphology of the area, accessibility and safety of
workers and the public;
environmental constraints, e.g. archeological, historical
and visual values;
pre-existing structures and infrastructure that may be af-
fected directly or indirectly;
capital and operating cost, including maintenance.
The user selects in the toolbox the mitigation measures to be
considered. To rank the selected mitigation measures, a simple
additive algorithm with weighted scoring factors for both de-
fault criteria and user-defined criteria in the toolbox was devel-
oped. The ranking (R
i
) is therefore done on the basis of the
summation of weighted (w
i
) contributing factors (F
i
) for each
evaluation criterion:
R
i
=
w
i
· F
i
(1)
Where i are the mitigation measures selected by the user for
analysis, from 1 to
n
;
w
is the weighting factor proposed by the
toolbox; the default value for all w
i
at start is 1.0 and can be
changed by the user; and
F
is the scoring factor proposed by the
toolbox and which can be changed by the user
Values for
F
and
w
are proposed by the toolbox, based on a
decision support matrix. The user can change the values of
F
and
w
according to his/her experience and/or engineering judg-
ment. The user can also add additional factors F
i
that will then
be automatically included in the analysis.
The scoring factors (
F
i
) for each mitigation measure offered
as default in the toolbox are for the user to consider, adopt or
modify during his/her assessment of the problem at hand. The
scoring for all ranking parameters is on a scale of 1 to 10, where
1 describes the least favourable attribute (worst, lowest, poorest,
most expensive), and 10 the most favourable attribute (best,
highest, strongest, least expensive or not expensive). The scor-
ing of 0 is used when the mitigation measure is inapplicable or
inappropriate.
The weighting factor (
w
i
) reflecting the relative importance
of criteria or corresponding scoring factors is in the range of 0
(least) to 1 (most). The default value is set to zero, and the tool-
box assigns a values of unity (1) as a function of the input pro-
vided by the user in the following technological criteria catego-
ries: type of movement, type of sliding material, depth of
movement, rate of movement, groundwater, and surface water.
3.3
Priority setting
At the end of the ranking process, the toolbox lists the ranking
of the selected mitigation measures in the order of most appro-
priate to least appropriate measures. The calculated value for
R
i


