2190
Proceedings of the 18
th
International Conference on Soil Mechanics and Geotechnical Engineering, Paris 2013
building(B3). Although these values did not reach a dangerous
level per the general management criteria, for some areas, the
cumulated settlements reached over 10cm in the 10 years data.
Moreover, when comparing the settlement distribution in Fig. 1
to the distribution of thickness of filled land, in the greater
thickness of the filled land areas such as the Sport Ground(B4),
the Basketball Court(B5) and Asoka Square(B6), the settlement
is apparent. It is speculated that these higher settlement areas
have something to do with the thicker fill. On the other hand,
for the few heaving points like the upper slope of the Asoka
Square, it is the result of the surface concrete pavement heaving
caused by extrusion of the slope slide, not the ground surface
condition.
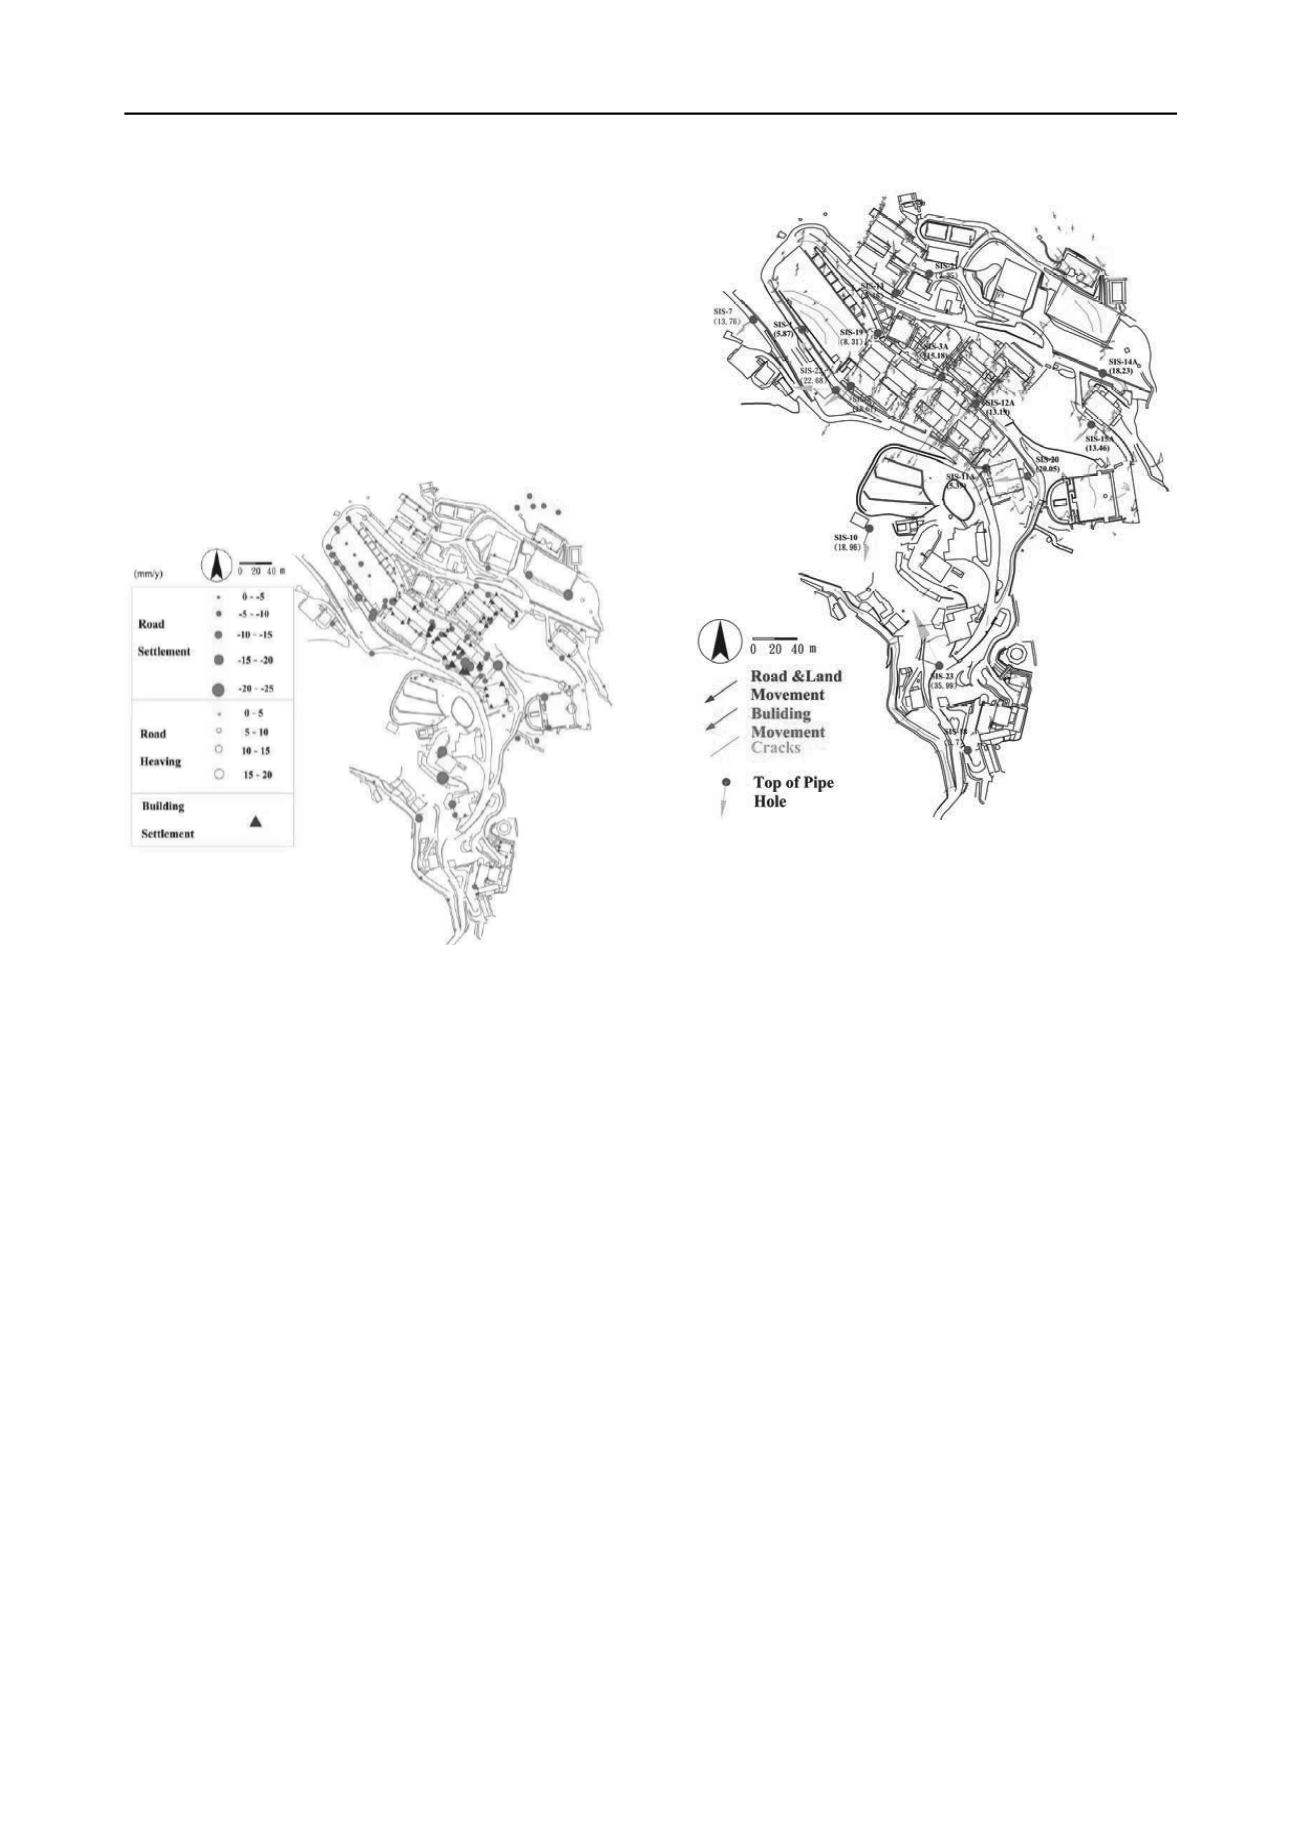
Fig. 1 The settlement distribution diagram
Figure 2 shows the displacement tracks of each observation
mark on the plan map. The scale of displacement has been
enlarged to 200 times to highlight its tendency. It is shown in
Fig. 2 that the main displacement direction is downward to the
slope in the southwest or south direction. Meanwhile, the larger
displacement is distributed, same as the aforementioned
settlement distribution, around the areas of Hui-tsui building,
Chih-an building and Wu-ming building. However, the upper
slope of the Asoka Square shows movement in the upward
direction to the slope. This also can be attributed to the
aforementioned heaving phenomenon caused by extrusion of
the slope slide, such that an overturning condition occurred in
that area. The cracks created in the crown can also confirm this
situation. Additionally, the direction of movement for the Sport
court is different from the upper slope Dormitory building. That
is because they are departing into different sliding blocks.
2.3 Correlation WITH rainfall
According to the results of the aforementioned settlement and
displacement distribution, the most critical areas are
concentrated in the Hui-tsui building, Chih-an building and Wu-
ming building. As expected, the most significant contributing
factor is rainfall. The correlation between settlement,
displacement and, rainfall for the Hui-tsui building is discussed
below.
The tendency of displacement with respect to time shown in
Fig. 3 is generally similar to that of settlement vs. time shown in
Fig. 4. Based on the increment tendency, both can be separated
into four distinct time segments: (1) May 2001 to March 2002,
(2) September 2004 to June 2006, (3) June 2007 to April 2009;
(4) April 2010 to January 2011.
When comparing the displacement and settlement time in
Fig. 3 and Fig. 4 with the rainfall record, the displacement and
settlement of the slope have a strong correlation with the
rainfall record. In addition to the rainfall, another important
influence factor to the displacement and settlement of the slope
is the construction. For instance, within the third time segment,
a new Library and Information Building were built with the
excavation for the foundation at the toe of the slope. This may
be the cause for the increased amount of displacement and
settlement in the third time segment, despite the greater total
accumulated rainfall in the second time segment (8973.5mm)
versus the third (7241.5mm).
Aside from accumulated amounts, rainfall rate and duration
also contribute to the threshold value that triggers displacement
and settlement of the slope. Jeng and Sue (2008) illustrated that
a rainfall threshold value of 800mm/month is able to trigger the
displacement and settlement of the slope.
3 THE INCLINOMETER MONITORING
Many inclinometers have been installed starting the year 2000.
Since then they have gradually settled in the test field, with
some being damaged due to deformation. At present, 32 holes
remain functional and are recording measurements. The results
shows a sliding layer that deforms in depth from 14 to 15m. As
seen from the core box the sliding occurs along the fracture
layer.
4 COMPARISON THE RESULTS BETWEEN
DISPLACEMENT MONITORING MARKS
AND THE INCLINOMETER
The displacement monitoring marks are able to characterize the
ground surface deformation and the inclinometer pipes can
describe the ground deformation for the entire depth. To
investigate the deformation of the slope, efforts were made by
comparing the deformation of the top of the inclinometer pipes
to the displacement monitoring marks. The comparison results
shown in Fig. 2 indicated that the tendency of slope surface
deformation obtained from both of these two data sets is
Fig. 2 displacement tracks and ground surface crakes distribution
B5
B4
B1 B2
B3
B6


