2191
Technical Committee 208 /
Comité technique 208
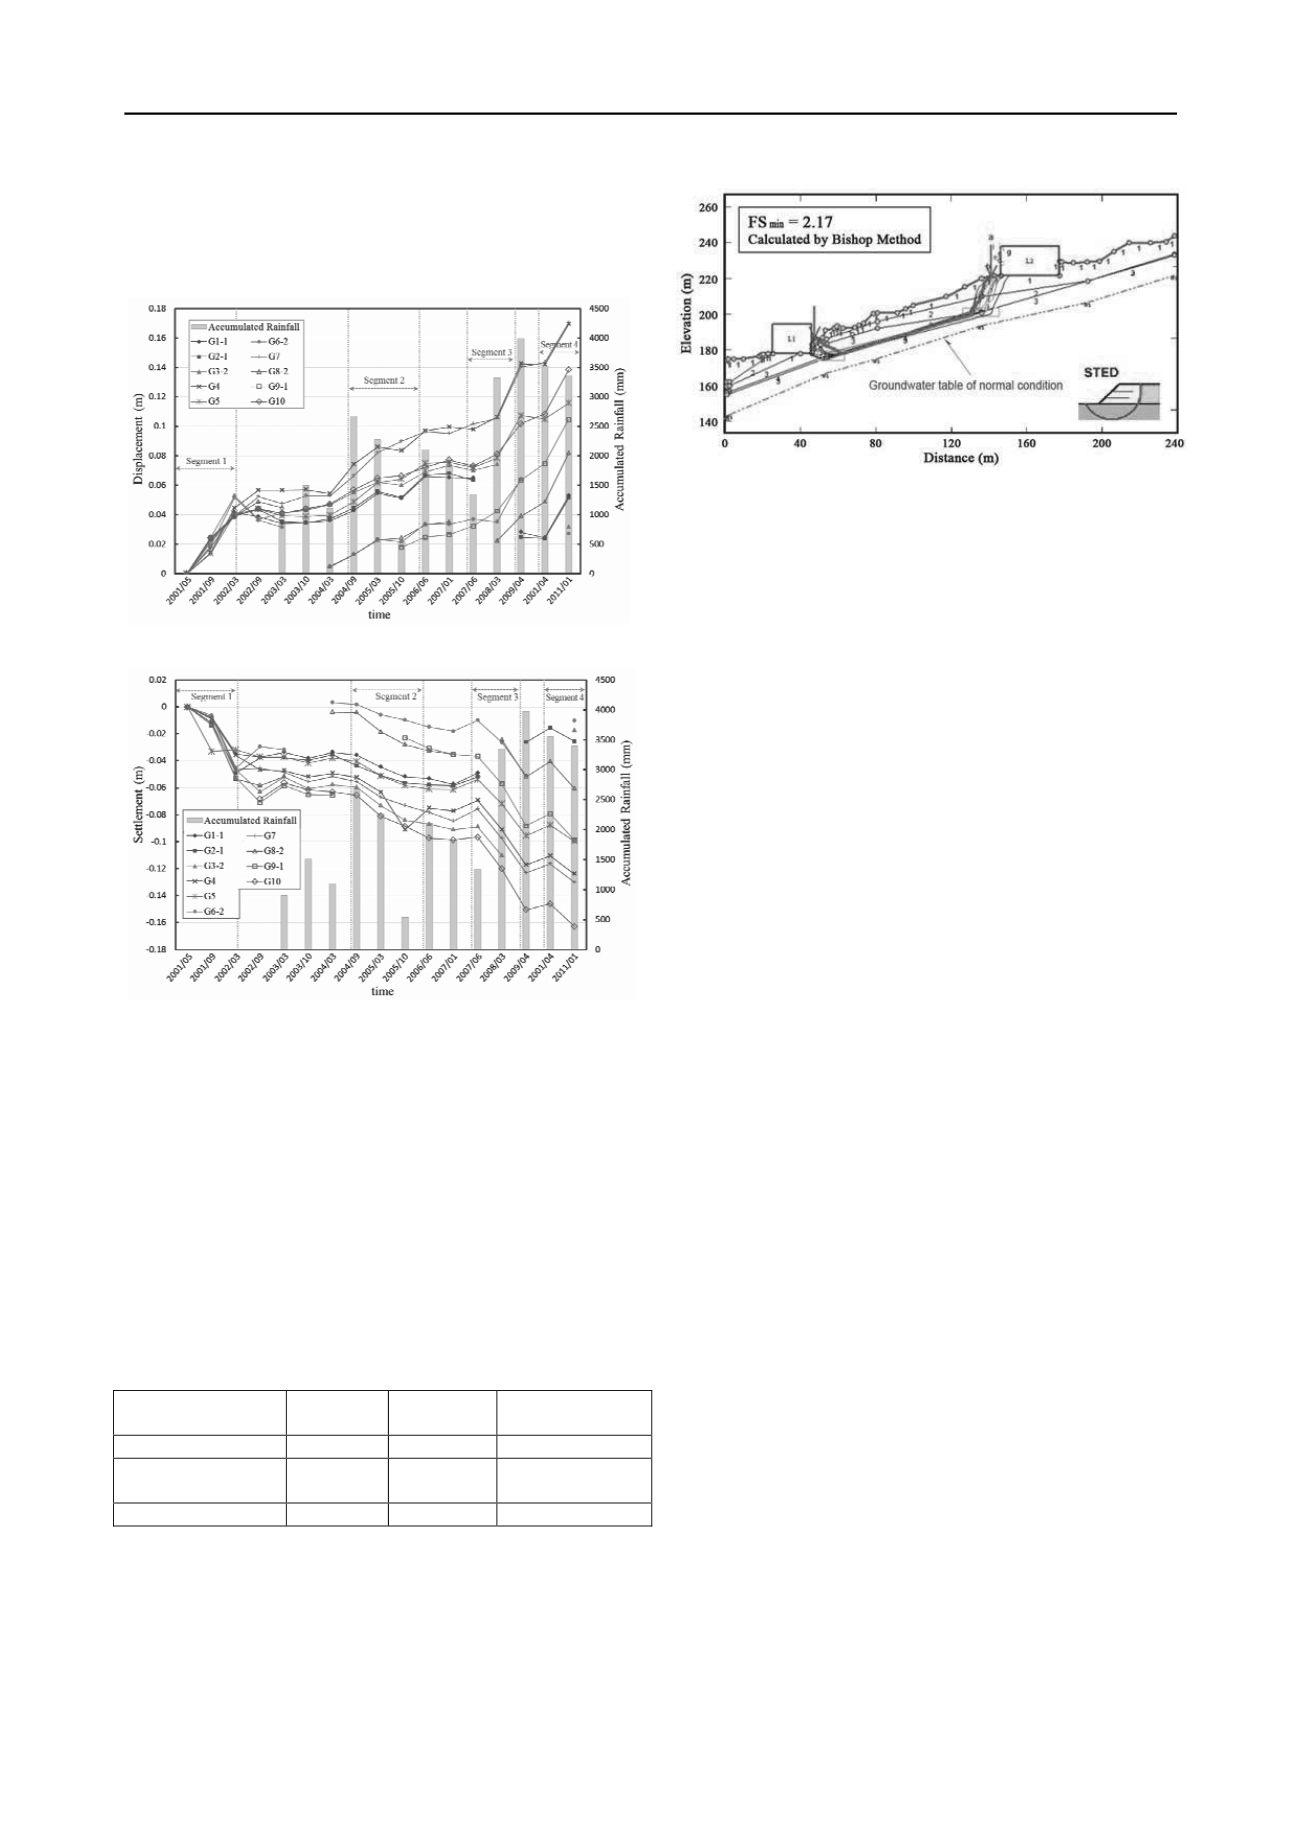
generally consistent. The primary slope deformation is toward
the southwest and south direction, similar to the slope surface
direction, which means the slope soil is generally moving
downward along the slope.
Fig. 3 Relation curves of displacement and rainfall for Hui-tsui building
Fig. 4 Relation curves of settlement and rainfall for Hui-tsui
building
5 SLOPE STABILITY ANALYSIS
After learning of the significant amount of slope deformation,
there was concern for the integrity of the slope and any
potentially hazardous contributing factors. To determine the
slope stability, the limite equilibrium progra
m-
STABL was
adopted and used for analysis. A simplified Bishop method with
circular failure type was selected for the study. The input soil
parameters were based on previous study (Jeng, 2003; Jeng and
Li, 2009 ), as shown in Table 1. Areas with similar ground
water variation and rainfall conditions were compared, and the
crack distribution on the slope were used to assess potential
failure areas
.
Table 1 soils and rocks parameters
soils and rocks
type
Cohesion
(kPa)
Friction
angle (°)
Unite
weight
(kN/m
3
)
Colluviums
18.45
29.92
19.31
sandstone and
shale alternation
41.52
32.24
25.52
Sandstone
41.85
34.60
23.86
Figure 5 shows the slope stability analysis results for normal
conditions. The safety factor is 2.17, which higher than the
suggested value 1.5, remains within a stable state. However for
rainfall conditions, when the ground water rises 3m, the safety
factor decreases to 0.86. An unstable condition can then happen.
Thus, it is concluded that the slope stability is significantly
influenced by the rise in ground water during rainfall events.
Fig. 5 Slope stability for normal condition (FS=2.17)
6 SLIDING BLOCKS DETERMINATION FROM
SETTLEMENT AND DISPLACEMENT RESULTS
According to the inclinometer monitoring results provided by
Jeng and Hsieh (2010), there are six sliding blocks within the
slope. In that study, the sliding rate, depth and area of each
block were presented. In addition to that information, this study
evaluates the result of ground surface movement, including
displacement direction and settlement, trend of ground water
flow, and the distribution of ground surface cracks. A
comprehensive evaluation was made to exam the previous
sliding blocks study results. Fig.6 shows the finding which
supports the presence of two sliding blocks. Among them, block
No. A-1 is located in the area around Wu-Ming building, Asoca
Square and the Chea-chau building; block No. A-2 is located in
the area around Sport ground where there is 20m of fill. These
two sliding blocks coincide with blocks R1 and L1 of the
previous study (Jeng and Hsieh, 2010). Both blocks show
movement in the shallow layer and are located in the active
sliding areas. Numerous cracks can be found along the ground
surface in these areas.
7 STABILIZE MEASURES AND THRESHOLD VALUE
OF RAINFALL
According to aforementioned stability analysis results, it was
learned that the rise of ground water in rainstorm conditions
significantly impacts slope stability. Consequently, slope
stability will be improved with the addition of drainage and
drawdown systems and retaining structures. With budget and
effectiveness in mind, the first step should focus on the area
around the Wu-Ming building where the ground water and
geological condition is least favorable. A detailed description of
improvement steps includes
:
1. Improvement of the ground surface drainage system for
water runoff.
2. Installation of six catchpits with the horizontal drainage
pipes, shown in Fig.7, to draw down the ground water level.
3. Filling of ground surface cracks to prevent seepage of water
runoff into cracks.
4. Construction of bore piles and tiebacks with ground
anchors behind the Wu-Ming building to strengthen the
retaining structure for the toe of the slope.
Finally, for the safety management of the slope, threshold
curves were established to illustrate the relationship between
rainfall intensity and accumulation, and the observed slope
deformation (Fig. 8). Looking ahead, these curves can be used
for predicting slope stability before typhoons as it often brings
significant amount of rainfal. The information correlating
rainfall and slope stability improves slope management and risk
assessment. To minimize the slop disaster from occurring, the
proposed approaches are believed to be beneficial to the
community.


