2195
Technical Committee 208 /
Comité technique 208
positive for reducing the rate of movement. The slope stability
analysis was considered only indicative due to the complex
nature of the sliding mass (fig 2) and greater emphasis was
placed on slope monitoring.
The data were further analyzed to verify the regressive type
of movement and to identify a possible onset of a progressive
type of movement, leading to failure. One method to evaluate
monitoring data is the inverse velocity measurement versus
time. Based on this method, as described by (Rose and Hungr,
2007), when the inverse velocity of slope movement is plotted
against time, failure is imminent as the trend line approaches
zero values (velocity increases asymptotically). In Figure 5 the
inverse velocity versus time is presented for prism 2A4.
0,00
0,05
0,10
0,15
0,20
0,25
0,30
0,35
0,40
01/01/12
31/01/12
01/03/12
31/03/12
30/04/12
30/05/12
29/06/12
29/07/12
28/08/12
Inverse Velocity (day/mm)
Date (days)
Figure 5. Inverse velocity versus time for prism 2A4
Figure 5 suggests that if this method is to be followed, at
numerous times the mine slopes could be at imminent collapse.
This is evaluated based on the extrapolation to zero of the
regression lines for different time intervals (straight lines). For
example the first imminent collapse could have been evaluated
to have occurred on 01/03/12, which did not happen.
0
10
20
30
40
50
01/01/12
31/01/12
01/03/12
31/03/12
30/04/12
30/05/12
29/06/12
29/07/12
28/08/12
Velocity (mm/day)
Date (days)
1A2
2A2
4A2
5A2
6A2
Figure 6. Velocity versus time for prisms of bench 2
0
50
100
150
200
250
300
0
5
10
15
20
25
30
1/1/2012
31/1/2012
1/3/2012
31/3/2012
30/4/2012
30/5/2012
29/6/2012
29/7/2012
28/8/2012
Cumulative Precipitation (mm)
Precipitation (mm)
Date (days)
LG26 (Pt)
LGS4 (NP)
Cumulative
Figure 7. Precipitation versus time from two stations
Subsequently regression analysis presented times that failure
could take place. This graph presents a situation where the
method could not work properly without evaluating other
critical factors such as precipitation or excavation unloading.
Figure 6 presents velocity versus time for all prisms of bench
2 while figure 7 shows the daily and cumulative precipitation
for two weather stations. The mine is located in between these
stations with a distance of about 7km. No precipitation data at
the mine were available.
From the evaluation of figures 6 and 7, a strong correlation
between the precipitation and the increase of velocity is
observed. Further observation of figure 6 provides information
of a stick – slip mechanism and a regressive type of movement
in which the velocity does not increase or decrease at a constant
rate but undergoes abrupt changes. During and after heavy
precipitation the water filled tension cracks provide an
increasing driving force. As displacement continues, the width
of the cracks increase and the water level drops with a
dissipation of water pressure. This is a repetitive situation which
modifies the velocity of the sliding mass. Beginning of
February 2012 limited (day shift) remedial excavation was
executed on bench 1 and above to reduce the weight of the
sliding mass. Such excavation increased after March 2012 being
conducted on 24hour shifts. As a result movement velocities
were reduced after that date.
In retrospect the movement was of the regression type (or
behaved in this respect due to the excavation at the top of the
slope) as can be seen from the displacement measurements at
bench 4 presented in Figure 8. In this graph the displacement at
the bench is plotted versus time for four different prisms in
different locations transversally placed on the slope (Figure 2).
0
500
1000
1500
2000
2500
3000
3500
01/01/12
31/01/12
01/03/12
31/03/12
30/04/12
30/05/12
29/06/12
29/07/12
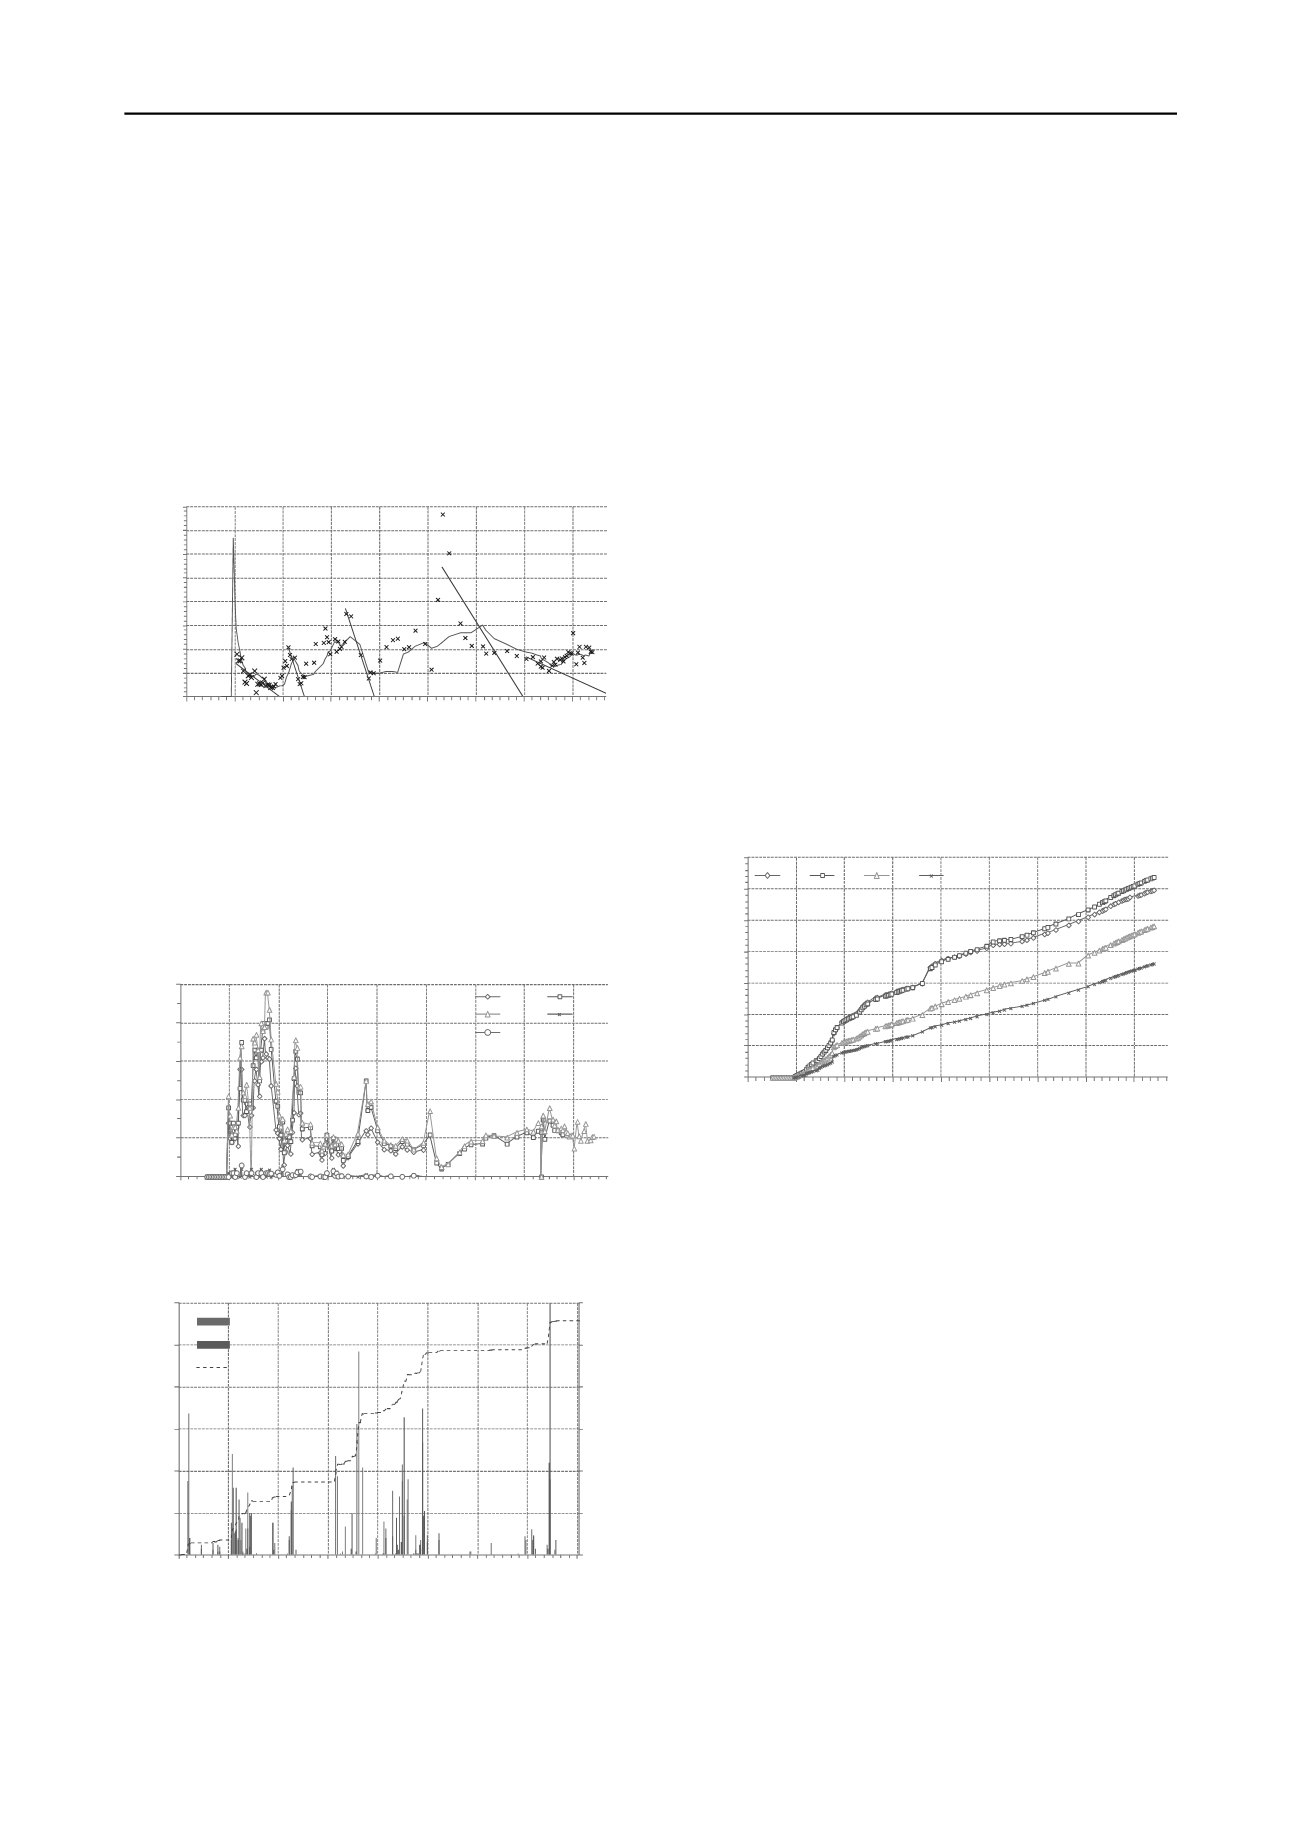
28/08/12
Cumulative displacement (mm)
Date (days)
4A1
4A2
4A3
4A4
Figure 8. Cumulative displacement of prisms on bench 4
When the cumulative displacement becomes convex, movement
acceleration is evident and a progressive type of movement can
be inferred. When the cumulative displacement becomes
concave then deceleration takes place. As can be seen from
Figure 8 displacements “cyclically” change from convex to
concave and back to convex meaning that this is of a mixed
condition where the regressive type of movement prevails.
Although the cumulative displacement of this slope for a period
of 7 months is over 3m, the slope is still in a regressive type of
movement and therefore mine operations continue.
5 GEOMETRICAL MOVEMENT INFORMATION
The dense grid of monitoring prisms together with the high
accuracy of the robotic total station produced additional
invaluable data for the moving mass. As can be seen from
Figure 2 the vectors of motion are presented with arrows. The
continuous arrows present monitoring information until the
writing of this paper. The dashed arrows present monitoring
data that were discontinued for operational reasons at different
times. As can be seen from the arrows and the displacements at
bench 4 (figure 8) the slope moves more to the east than to the
west while both translation and rotation occurs at the same time.
The reason for this complex movement can be explained taking


