2207
Technical Committee 208 /
Comité technique 208
4 PRELIMINARY MONITORING RESULTS
4.1
Moisture Probes and Tensiometers
Figures 2 and 3 show the variations of the volumetric water
content and the matric suction of Borehole M3 at the crest of
the sliding slope from November 2011 to June 2012. By
examining the volumetric water content and the matric suction
records and their comparison with daily rainfall in borehole M3
at the crest of the sliding slope during the above period (Figures
2 and 3), the following observations can be made:
(1) The volumetric water content increased due to rainfall
infiltration in the wet season and decreased due to evaporation
in the dry season. The matric suction decreased due to rainfall
infiltration in the wet season and increased due to evaporation
in the dry season.
(2) The volumetric water content at different depths was not
uniform. Generally, the volumetric water content at a shallow
depth was lower than that at greater depths during the dry
season, while the volumetric water content at a shallow depth
was higher than that at greater depths during the wet season.
The matric suction at different depths was not uniform too.
Generally, the matric suction at a shallow depth was higher than
that at greater depths during the dry season, while the matric
suction at a shallow depth was lower than that at greater depths
during the wet season.
0
10
20
30
40
50
Date
Volumetric water content (%)
0
20
40
60
80
100
120
140
160
180
200
01/11/12
01/26/12
02/10/12
02/25/12
03/11/12
03/26/12
04/10/12
04/25/12
05/10/12
05/25/12
06/09/12
Daily Rainfall (mm)
M3-3(3.0m)
M3-2(2.0m)
M3-1(1.0m)
Figure 2. Variations of volumetric water content and daily rainfall from
November 2011 to June 2012 in borehole M3 at the crest of the sliding
slope.
-10
0
10
20
30
40
50
60
70
80
Date
Soil Suction (kPa)
0
20
40
60
80
100
120
140
160
180
200
01/11/12
01/26/12
02/10/12
02/25/12
03/11/12
03/26/12
04/10/12
04/25/12
05/10/12
05/25/12
06/09/12
Daily Rainfall (mm)
T3-1(1.0m)
T3-2 (2.0m)
T3-3(3.0m)
Figure 3. Variations of matric suction and daily rainfall from November
2011 to June 2012 in borehole M3 at the crest of the sliding slope.
4.2
Open Standpipes and Piezometers
The monitoring of the three open standpipes was carried out by
using a dipmeter. The monitoring of the open standpipes was to
check the monitoring data of nearby installed piezometers.
Figure 4 shows the variations of the ground water levels in
Borehole P1 at the toe of the sliding slope from November 2011
to June 2012. By examining the ground water level records and
comparing them with the daily rainfall data during the above
period, the following observations can be made:
(1) The pore water pressure at P1-A was higher than that at
P1-B. It probably implies that there was a perched water level in
the sliding slope and the permeability of the residual soil is
higher than that of CDG.
(2) The groundwater level deceased around 6.0 m at both P1-
A and P1-B.
(3) The rise of the groundwater level was sensitive to rainfall,
and it was more sensitive at shallow depth. Furthermore, there
was a time lag for monitoring the highest ground water level
due to rainfall.
(4) The highest groundwater levels monitored in November,
2011 was probably due to the heavy rainfall during the wet
season in 2011, which caused the landslide.
20
22
24
26
28
30
32
34
36
38
40
Date
Elevation (m)
0
20
40
60
80
100
120
140
160
180
200
12/12/11
12/27/11
01/11/12
01/26/12
02/10/12
02/25/12
03/11/12
03/26/12
04/10/12
04/25/12
05/10/12
05/25/12
06/09/12
Daily Rainfall (mm)
P1-A (9.5m)
P1-B(12.5m)
Figure 4. Variations of ground water level and daily rainfall from
November 2011 to June 2012 in borehole P1 at the toe of the sliding
slope
4.3
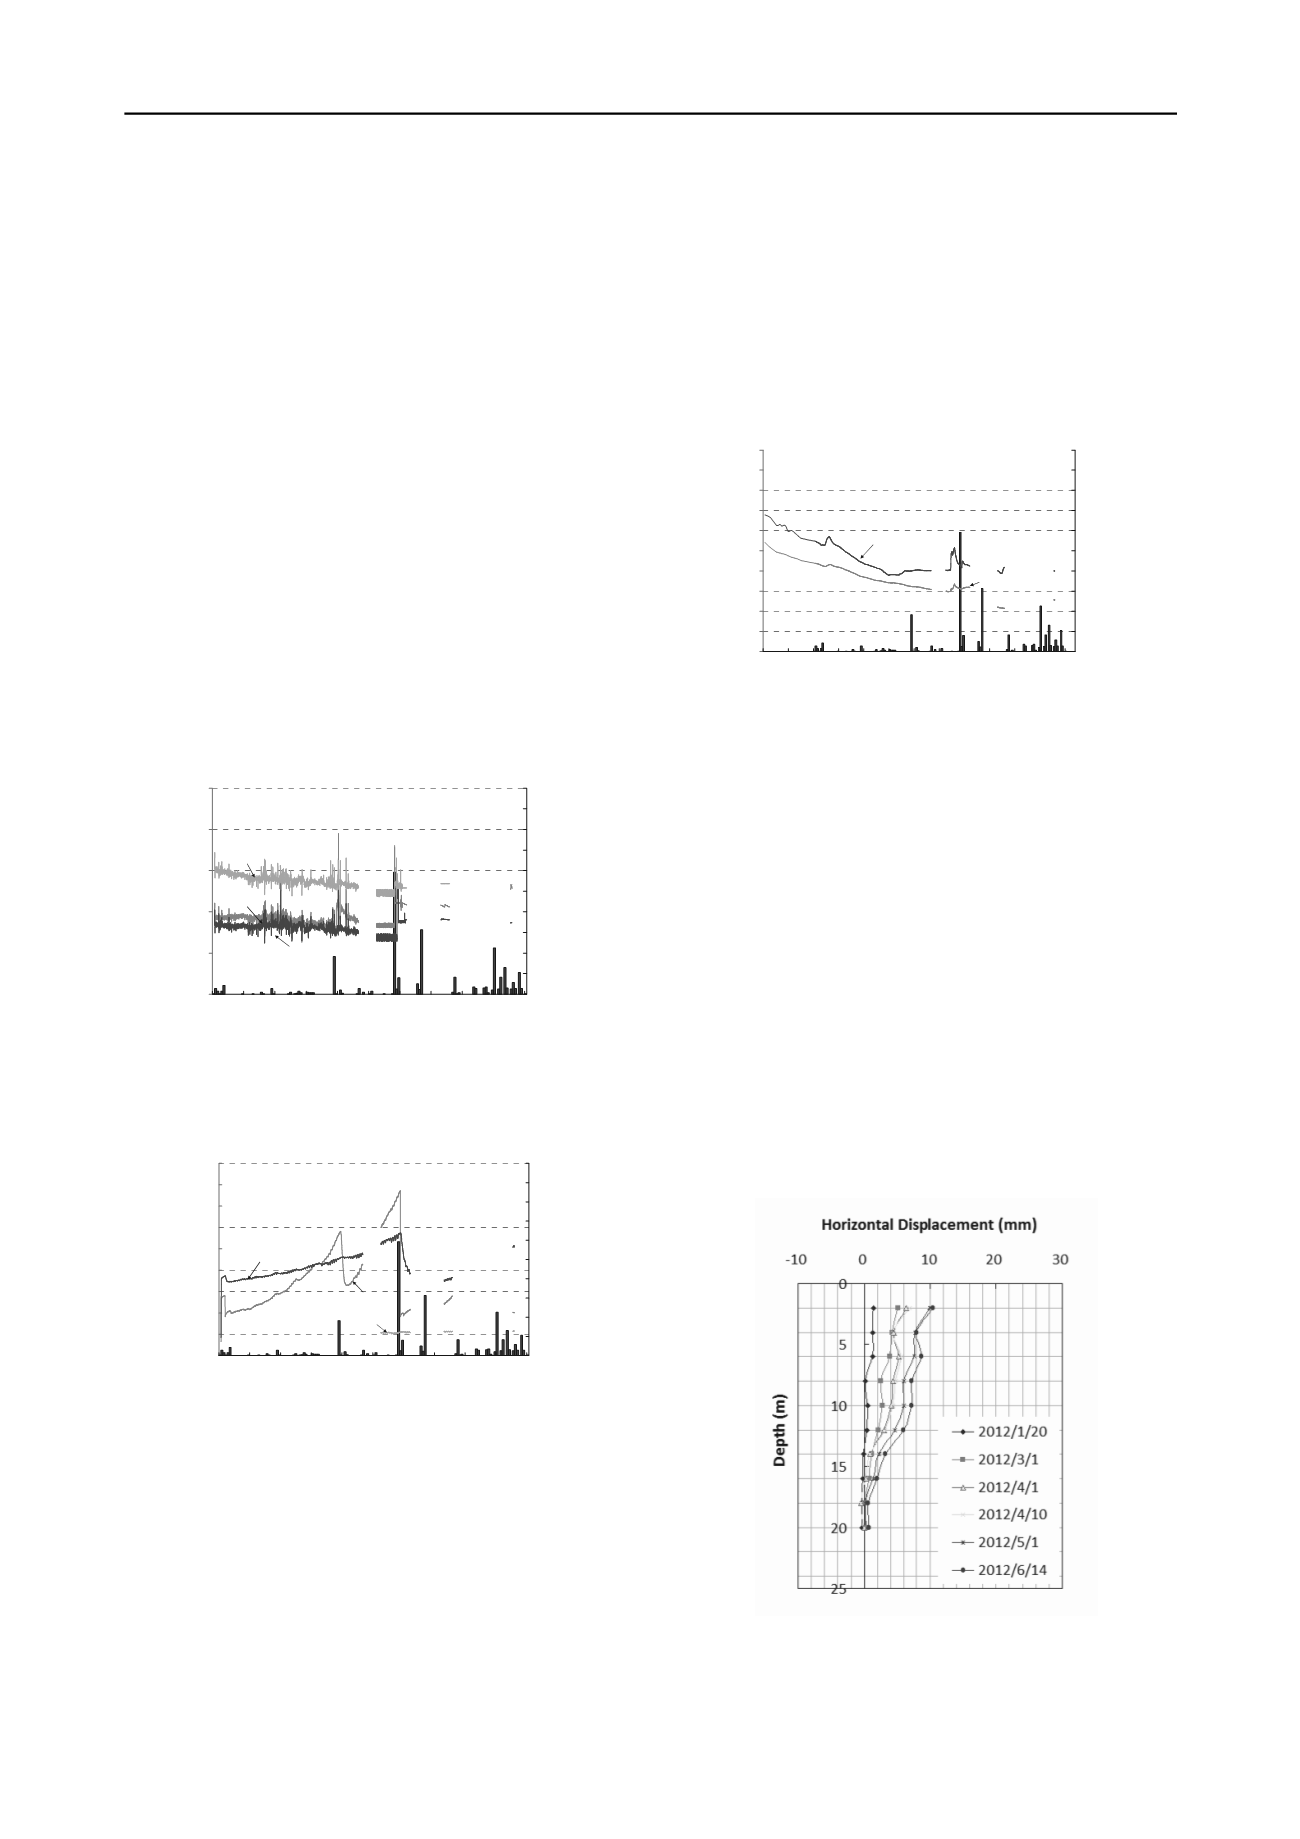
Inclinometers
Figure 5 shows the monitored horizontal displacements from
November 2011 to June 2012 in borehole IN1 at the toe of the
sliding slope. By examining the monitored horizontal
displacements during the above period, the following
observations can be made:
(1) The maximum horizontal displacement from June 2011
to July 2012 in borehole IN1 at the toe of the sliding slope was
about 10.0 mm (Figure 25).
(2) The monitored sliding slope was sliding slowly. It is
believed that with rainfall infiltration, the matric suction in soils
at shallow depth partially disappeared, which decreased the
stability of this sliding soil slope.
(3) The decease of groundwater level was up to 6.0 m during
the dry season, however, the increase of groundwater level due
to the heavy rainfall on April 7 was less than 1.0 m, therefore,
the maximum horizontal displacement was insignificant.
Figure 5. Horizontal displacements from November 2011 to June 2012
in borehole IN1 at the toe of the sliding slope


