2212
Proceedings of the 18
th
International Conference on Soil Mechanics and Geotechnical Engineering, Paris 2013
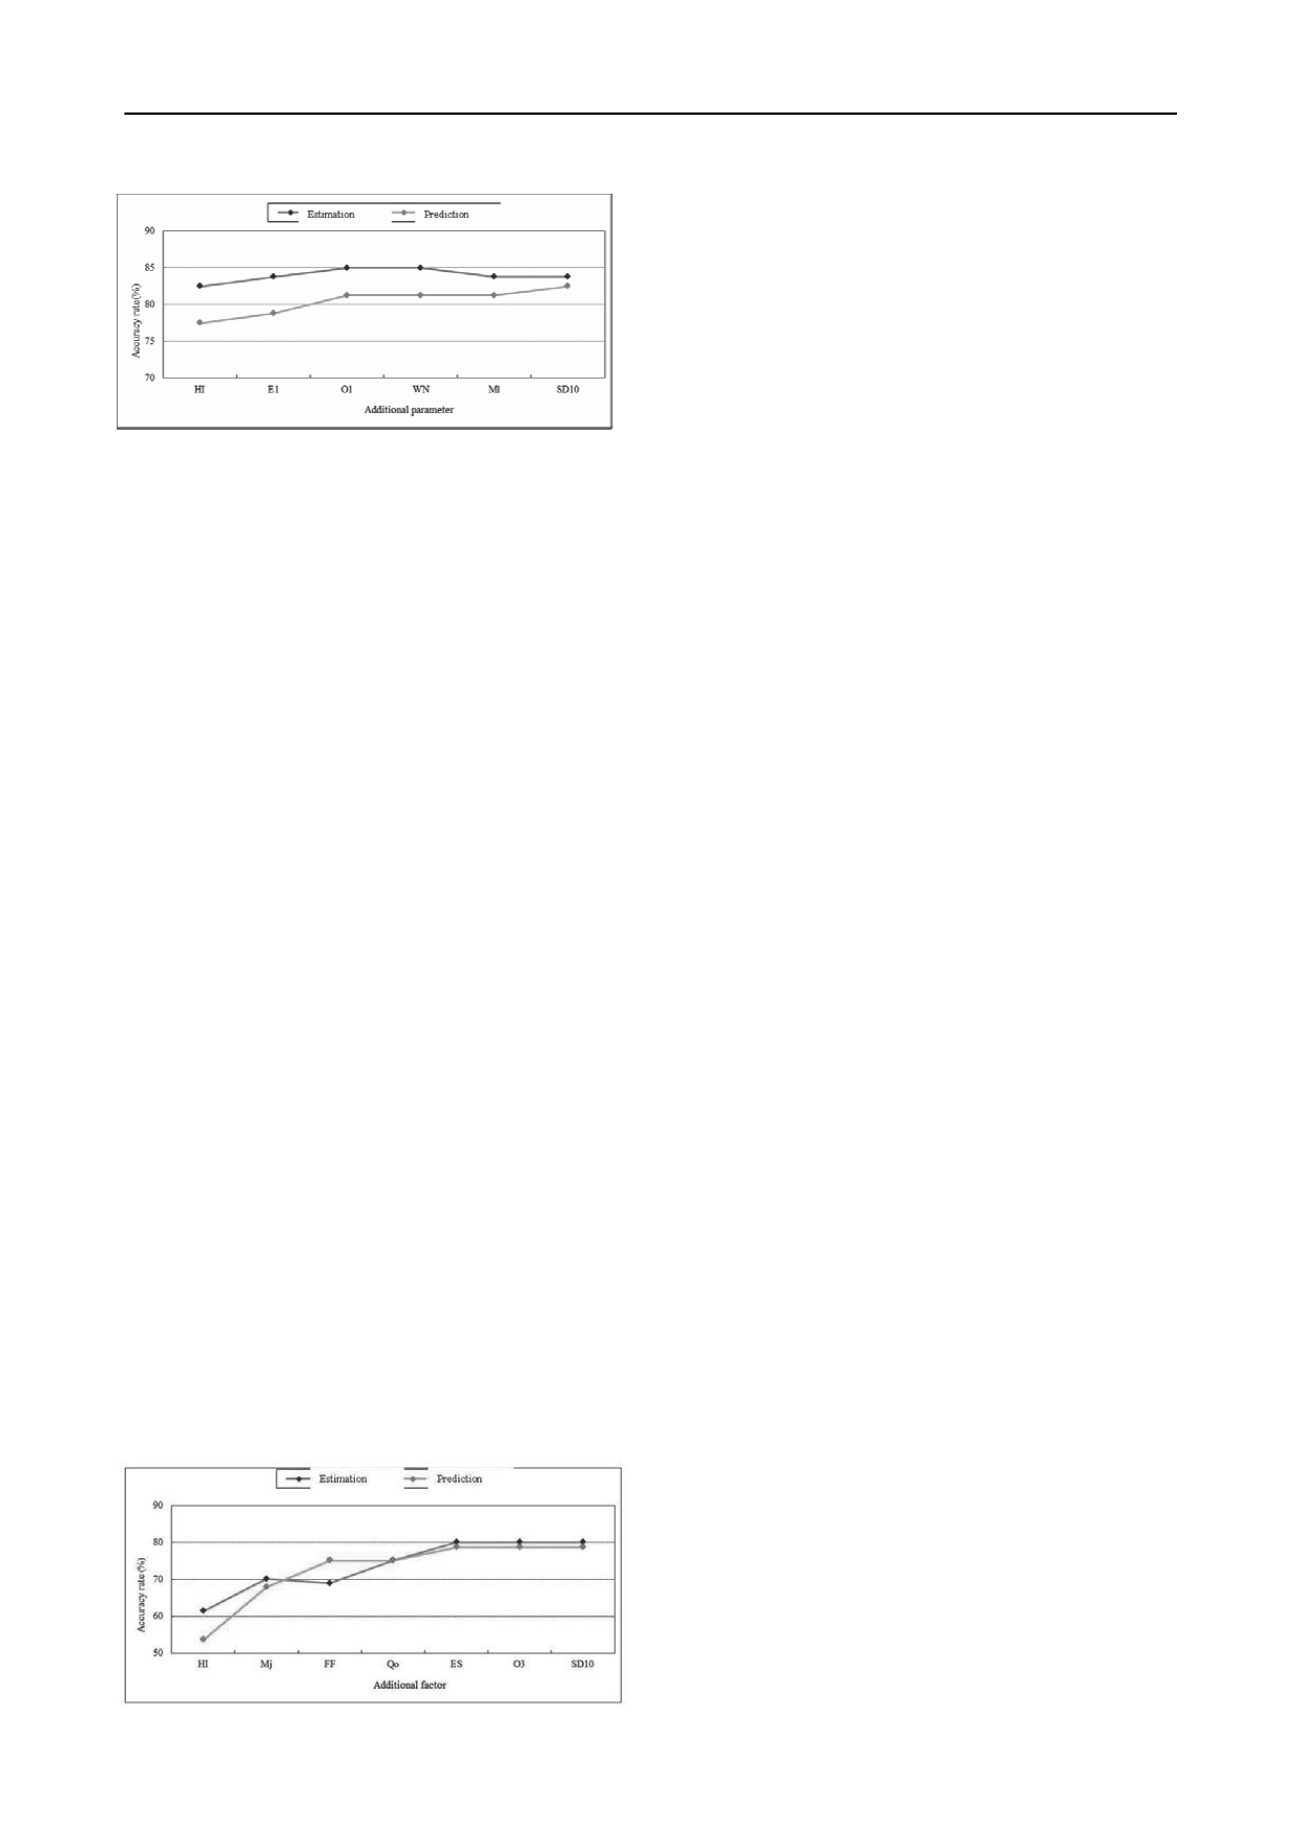
Figure 3. Accuracy rates of estimation and prediction for Zone C
The estimation accuracy rate is 83.3%, and the prediction
accuracy rate is 82.4% with a difference of 0.9%.
From Figure 3, it was found that the accuracy rates for both
estimation and prediction increased steadily with additional
factor up to O1 but then varied for Zone C. It appears that the
accuracy rate would become stable only with factors up to O1,
as:
e with the factors up to ES
y, and the
umulation. The discrimination value for 30%
accumulation is 0.325 and for 70% is –1.720 for Zone D. Thus
nts can be evaluated in all three
ctors are
contributing to the model effectively. The final potential of the
uated based on the values of
n in all three models properly.
Lin
ol
.
Special Report 176, National Academy of Science, Washington,
D.C. 17-27
aiwan Geology Map (1/500,000), 1986, Central Geological Survey
and the model is rectified
y=15.531(HI)+0.019(E1)
-
0.007(O1)
-
9.255
(5)
The estimation accuracy rate is 85.0%, and prediction accuracy
rate is 81.3% with a difference of 3.7%.
From Figure 4, the accuracy rates varied for both estimation
and prediction, but the accuracy rates increased steadily with
additional factor up to ES for Zone D. It appears that the
accuracy rate would become stabl
onl
model is rectified as:
y=
-
5.685(HI)+0.032(Mj)
-
1.504(FF) –0.015(Qo) –0.085(ES)
+5.380
(6)
The estimation accuracy rate is 80.0%, and the prediction
accuracy rate is 78.6% with a difference of 1.4%.
For all three analyses, the prediction curves appear to be
quite stable and approach the estimation curves with the similar
trends. The resulting accuracy rates are satisfactory and the
differences between prediction accuracy rate and estimation
accuracy rate of all three models are all within 4%. Thus the
discrimination functions used is good for differentiating debris
flow torrents from non-debris flow torrents with satisfactory
results. Comparing the three modified function equations, not
all factors contributed effectively to the model for all three
models. The prediction accuracy rate actually reduced if all the
factors were included, which suggested over-fitting of the
estimation models. Observing the number of factors used for the
whole area prediction model is higher than the Zone C and Zone
D, it may doe to the complexity of multi-geological zones
included. The accuracy rate of the Zone D analysis appeared to
be lower than the other two analyses, which might due to less
samples were available for estimation and prediction compared
to number of samples in whole area and Zone C.
Based on the analysis results, the potential of debris flow
torrent can be evaluated using distribution of the calculated
discrimination function. The accumulated distribution density
Figure 4. Accuracy rates of estimation and prediction for Zone D
of 30% and 70% values are selected as the boundary indicators
for low-moderate and moderate-high potential. For the whole
area analysis, the discrimination function value for 30% is 0.506
and 3.092 for 70%. Thus the debris flow torrents with
discrimination values greater than 3.092 are classified as high
potential and moderate potential when discrimination values
range within 0.506 to 3.092. The debris flow torrents are
considered as low potential when the values are less than 0.506.
Similar procedures were applied to Zones C and D. For Zone C
the discrimination value for 30% accumulation is 0.765, and
3.143 for 70% acc
the potential of debris flow torre
analysis models.
6 CONCLUSIONS
In this research, the potential analysis of the debris flow torrents
in Nantou County was performed using discrimination analysis.
The influence factors included: watershed area, stream length,
form factor, hypsometric integral, stream mean slope, slope
distribution, slope aspect, and geological formation. Base on the
previous discussions, most influence factors selected are within
significance level. Among the factors used, the hypsometric
integral appears to be the most important factor, which is a
characteristic of geomorphic evolution of the watershed. The
second most important factor is the geological properties of the
analysis area. For all three models, the accuracy rates are about
80%, which suggests that the discrimination analysis provide
satisfactory results. The accuracy rate for Zone D is slightly
smaller than the accuracy rates for both the whole area and
Zone C, which might due to smaller sample sizes in both
estimation and prediction compared to the sample sizes of the
whole area and Zone C. The final model could be determined
based on the stability of accuracy rates in both estimation and
prediction. However, not all the significant fa
debris flow torrents can be eval
discrimination functio
7 REFERENCES
g J.J. 1997. Eng
Hun
ineering Geology Zonation of Taiwan
Lin M.L. and Chen T.C. 2005. Frame in renovation and feedback
mechanism of database of potential debris flow torrents. SWBC-94-
048 (Chinese)
Lin M.L. and Lien H.P. and Hsieh C.L. 2003. Follow-up investigation
and observation in developed tendency of potential debris flow
torrents. SWCB-92-107. (Chinese)
M.L. and Wen H.Y. 2006. Field investigation and trend analysis of
potential debris-flow rivers.
Sino-geotechnic
. 110, 45-54 (Chinese)
Robet L.S. and Raymond J.K. 1978.
Landslide analysis and contr
T


