2155
Technical Committee 208 /
Comité technique 208
by considering stress conditions in an infinite slope. Although
this choice represents an important simplification of the real
geometry, this assumption allows an immediate mechanical
evaluation of possible incipient instabilities within the fill and
provides an insight on the type of expected undrained
phenomena.
The application of the methodology is based on the
calibration of the MIT-S1 model parameters for the site-specific
properties of the Nerlerk sands. Given the lack of data, the
calibration procedure required a number of approximations.
Here only some key aspects of the calibration process are
described, while more details are available in Buscarnera and
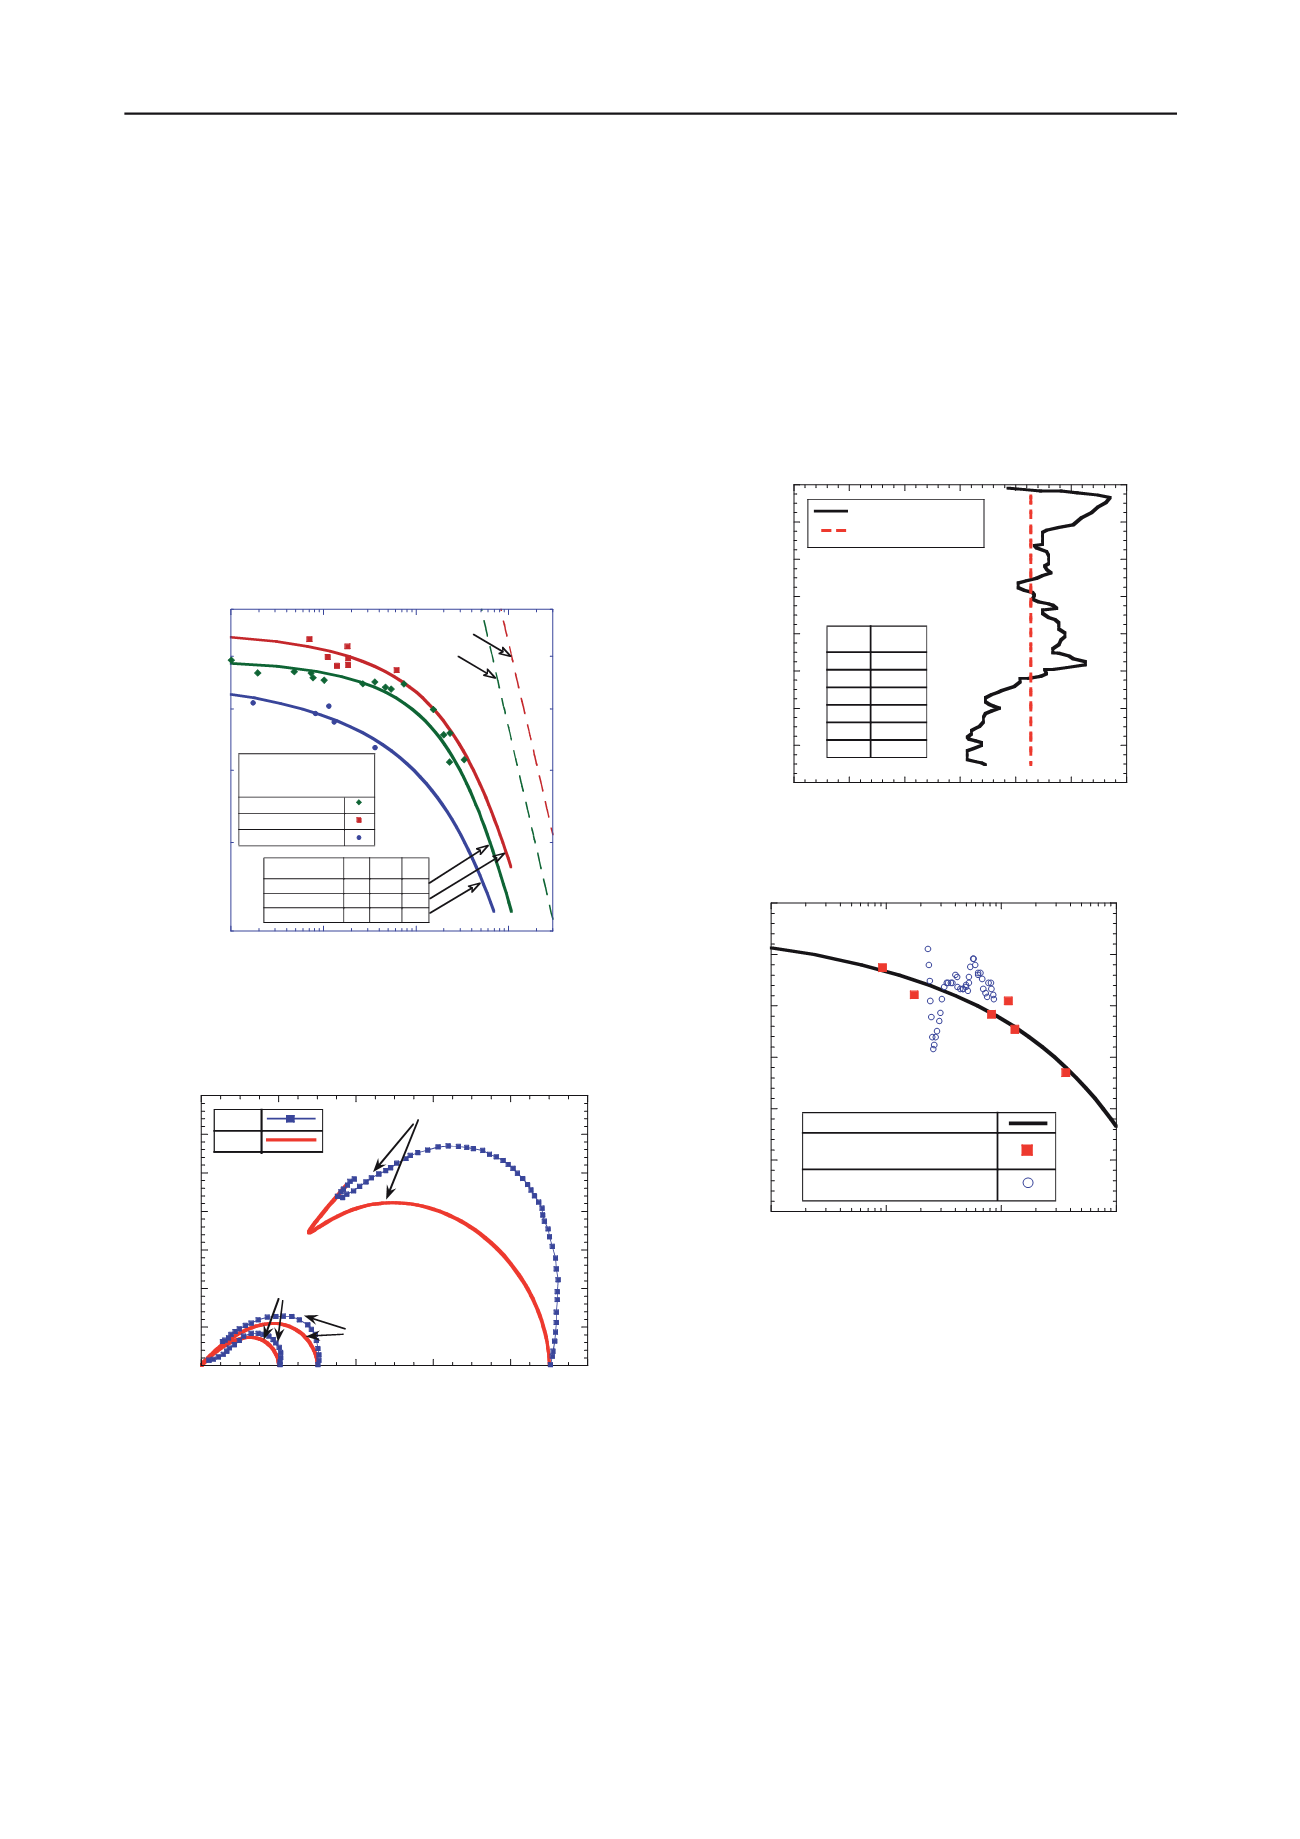
Whittle (2012). First, the parameters governing the critical state
of the Nerlerk sands have been evaluated on the basis of the
available literature data (Sladen et al., 1985a). Then, the critical
state properties of the Nerlerk sands have been compared with
those of similar Arctic sands (Figure 5), for which one-
dimensional compression data were available.
Figure 5. Comparison of Critical State Lines (CSL) and Limit
Compression Curves (LCC; dotted lines) for Erksak and Nerlerk sands
(while fines content affects the CSL of Nerlerk sand, no influence on
the LCC is assumed given the lack of data).
Figure 6. Comparison of computed and measured undrained shear
behavior for Nerlerk Sand with 12% fines.
Such comparisons, together with empirical considerations
compiled for a broad set of sands (Pestana and Whittle, 1995),
allowed the definition of a set of parameters for the
compression response of Nerlerk sands. The remaining model
constants were calibrated using data on the undrained response
(Figure 6).
In order to use the calibrated MIT-S1 model for the Nerlerk
berms it is finally necessary to define the in situ void ratios
along the slope profile and evaluate the stability charts of the
Nerlerk berm for several depths within the slope. The first step
is largely dependent on a reliable interpretation of the available
in situ tests. Several CPT tests were performed on the hydraulic
fills at Nerlerk, with the aim of estimating the in situ density.
For consistency with prior studies (Sladen et al. 1985b; Lade
1993), the current analyses assume that relative density (D
r
) can
be estimated using the CPT correlation proposed by Baldi et al.
(1982). It is clear that the choice of a specific interpretation
method for CPT test results will affect the estimation of relative
density (and, in turn, the model predictions). This uncertainty,
however, is probably unavoidable in any method of
interpretation. Figure 7 shows that the estimated values for D
r
range from 30 to 55 %, while Figure 8 illustrates the
distribution of these initial states relative to the CSL of Nerlerk
sands with 12% fines content.
Figure 7. In situ relative density from CPT tests (Baldi et al. 1982)
Figure 8. Relative location of in situ and critical states for Nerlerk sands
Figure 9 shows the computed stability charts at selected
depths for infinite slopes in Nerlerk sand, while Figure 10
illustrates the undrained response predicted by the MIT-S1
model at various depths for a slope made of the same material
and characterized by a slope angle
α
=13°.
The results show that the magnitude of the shear perturbation
needed to cause instability can be significantly affected by the
selected depth within the slope profile. More specifically, the
analyses define the initial state of stability within the Nerlerk
berm slopes in a proper mechanical sense, allowing a prediction
of the critical inclination for incipient instability. Since the
Nerlerk berm was constructed at slope angles in the range
α
=10°-13°, these results suggest that the Nerlerk slopes were
likely not in an incipient state of instability, and additional shear
stresses were required to trigger flow failures. In other locations
where steeper slopes were recorded, however, only very small
perturbations in shear stress could have triggered failure. This
result suggests that an undrained collapse triggered by rapid
deposition can be considered as a mechanically feasible failure
mechanism for the berm.
10
100
1000
10
4
0.4
0.5
0.6
0.7
0.8
0.9
Mean Effective Stress, p' [kPa]
Interpreted CSL Data
Sladen et al., (1985)
Jefferies & Been (1991)
Erksak
Nerlerk 2% Fines
Nerlerk 12% Fines
p m
φ
'
mr
MIT-S1 Model
2.7
0.49
21
Erksak
2.3
0.42
25°
Nerlerk-2%
2.6
0.21
21°
Nerlerk-12%
Nerlerk LCC
Erksak LCC
Void Ratio, e
0
100
200
300
400
500
600
700
0
200
400
600
800
1000
(e=0.745; p'
0
=200 kPa)
(e=0.734; p'
0
=300 kPa)
(e=0.638; p'
0
=900 kPa)
Mean Effective Stress, p' [kPa]
Deviator Stress, q [kPa]
Data
Model
0
2
4
6
8
10
12
14
16
0
10
20
30
40
50
60
D
R
from Baldi et al. (1982)
Depth Averaged D
R
Vertical Depth, z [m]
Relative Density, D
R
[%]
D
R
[%]
z [m]
44.8
3
43.75
5
48.9
8
45.58
10
33.5
13
33.82
15
0.5
0.55
0.6
0.65
0.7
0.75
0.8
1
10
100
1000
Void Ratio, e
Mean Effective Stress, p' [kPa]
MIT-S1 CSL
CSL Data
(after Sladen et al., 1985-b)
Initial State within the Nerlerk slopes
(after Sladen et al., 1985-b)


