2147
Technical Committee 208 /
Comité technique 208
where: δ
i
and
i
- respectively the total displacement of
i
-th
point o
c
f the most probable slip surface, calculated from the
a
external loads are equal to calculated values, i.e.
n р
The value of the safety factor coefficient of the slope in the
case of plastic regio
by the formula
tion of its own weight of soil, provided that
q
n
→0, and taking
into account dead weight of soil, provided that the value of the
intensity of the
q =q
.
ns in the near the slope area is determined
сдS сдS
удS
K
(8)
re:
удS
and
сдS
– squares of restraining and shearing
force’s diagrams, built along a section of the most probable slip
surface that is in the region of plastic deformation,
удS
and
сдS
- squares of restraining and shearing force’s diagrams,
built for the area most likely slip surface, which is outside the
boundaries of the plastic deformation regions. In that way, if in
a soil mass there are no plastic deformation regi
удS
whe
ons or their
zes are small, then the proposed procedure excludes from
weight of the soil,
which, as noted above, it is impossible to determine exactly
esign schemes automatically generate fields
f various shapes, endowed with certain properties, including
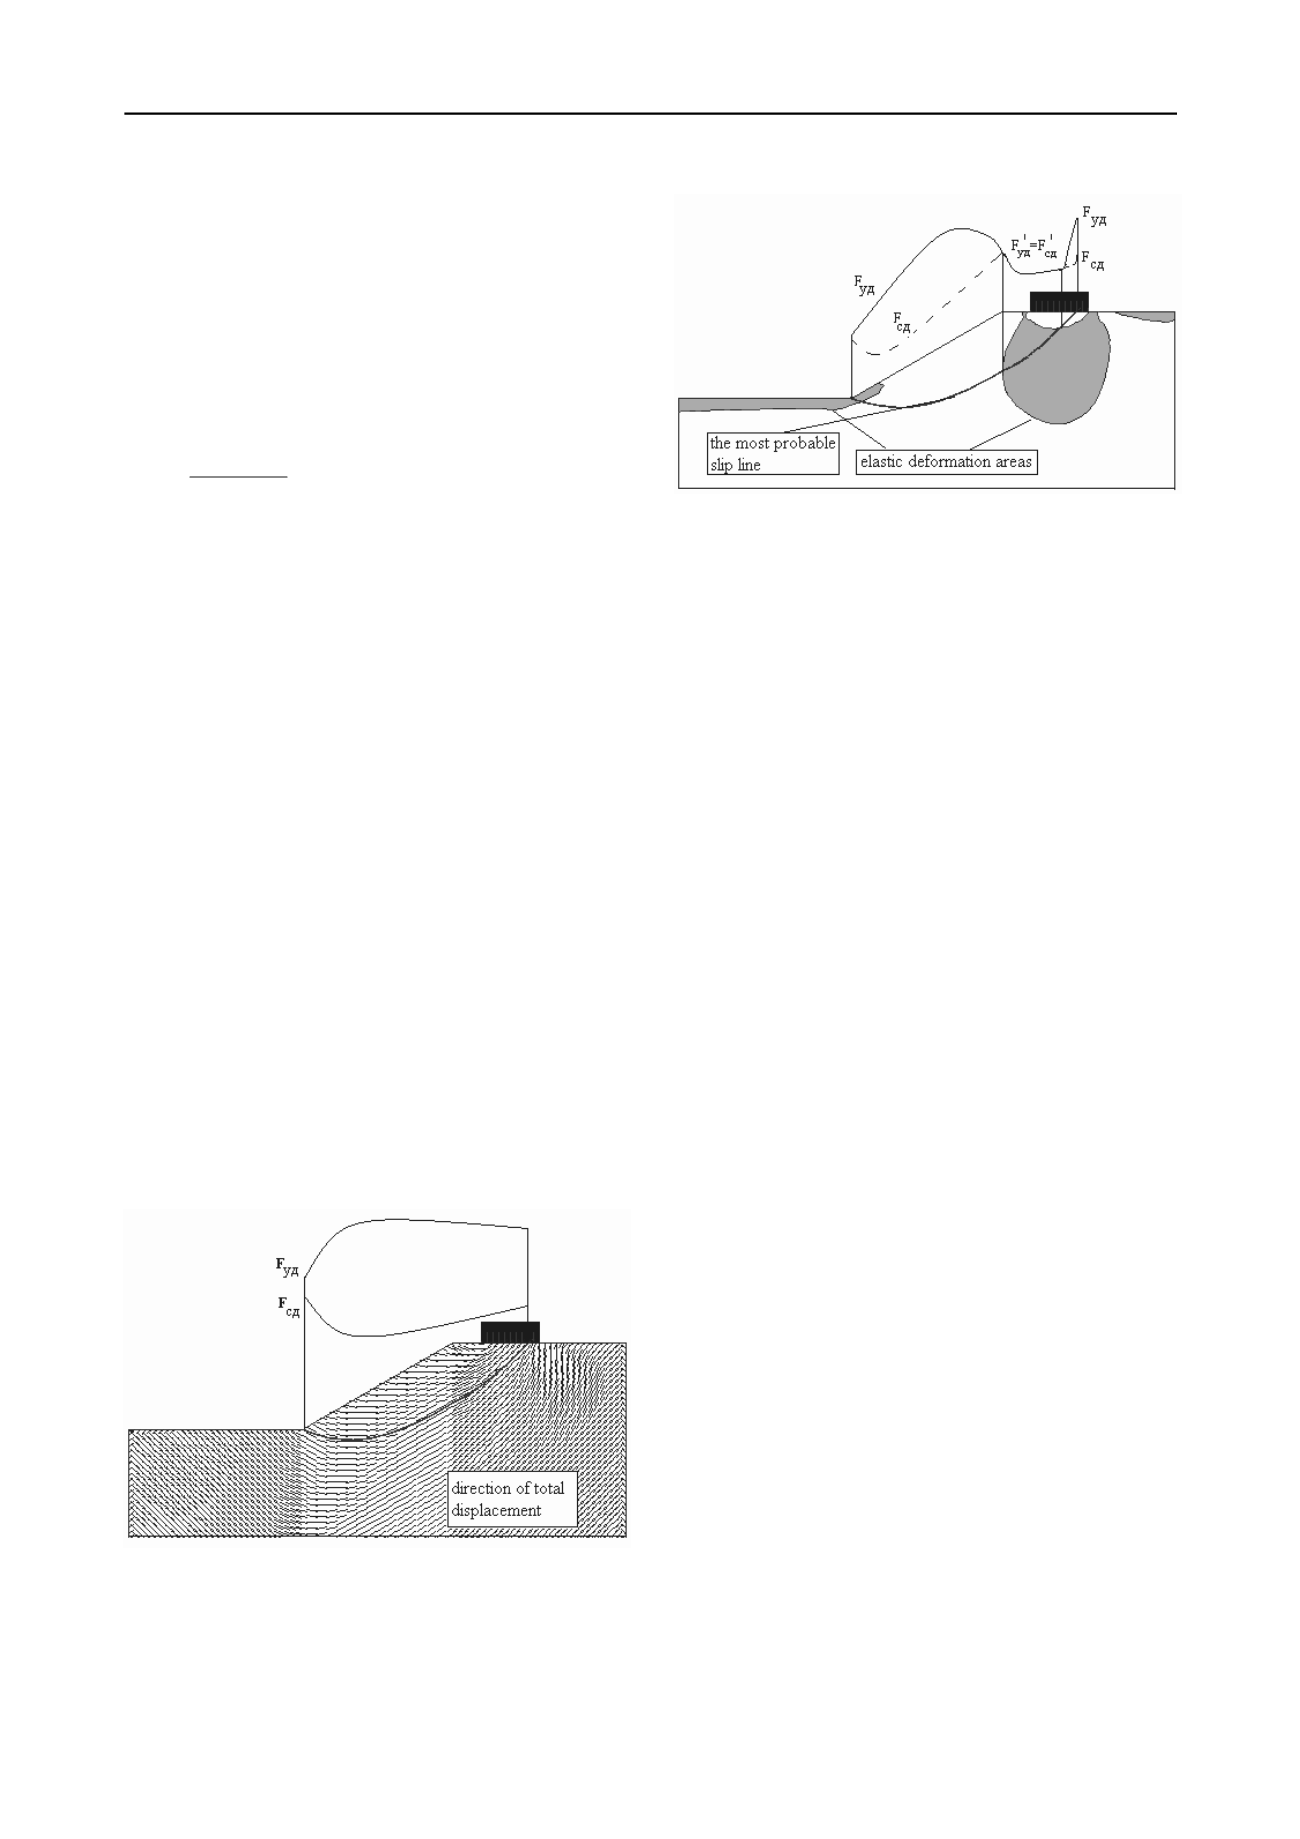
the voids. Figures 1 and 2 show the most probable slip surfaces
in the absence of the plastic deformation areas and while their
development. Here
si
examination of displacement from dead
what increases the reliability of the getting results.
3.
PROCEDURE FORMALIZATION
Described above procedure is formalized in a computer program
(Bogomolov and others, 2010), which allows to calculate
stability of homogeneous slopes and slopes of complex
geological structure with any configuration of the outer
boundary. At the same time all strength and deformation
characteristics of the soil are taken into account, to the surface
of the slope can be applied almost any number of point and
distributed loads of any orientation, length and intensity. It is
possible inside the d
o
Figure 2. Work diagrams of restraining and shearing forces provided
formation of plastic deformation areas
built in the computer program shell developed by the authors
work diagrams of restraining and shearing forces acting at the
points of the sliding surfaces are showed. Areas of diagrams are
calculated automatically and are used in calculations of the
safety factor value (see equation (8)).
Note one more circumstance. If the slope is uniform, then
safety factor value calculated by the proposed method is
independent from the value of deformation modulus of soil
E
о
,
as in this case, displacements linearly depend on the numerical
value. If the slope is not uniform, then the stresses at the points
of soil mass will depend on size of the deformation modules and
coefficient of lateral earth pressure of the nearby geological
engineering elements. Consequently, the safety factor value will
also be a function of these variables. This fact cannot be
accounted by any of these methods, during the implementation
of which analysis of the stress-strain state of the soil mass is not
conducted.
4. COMPARISON OF NUMERICAL RESULTS WITH
EXPERIMENTAL DATA AND FIELD OBSERVATIONS
We (Bogomolov & Vereshchagin, 1990) conducted experiments
on the destruction of loaded slopes, made on the models from
equivalent materials, as a basis for which were used: a) a
mixture of river sand (97%) and motor oil (3%) having the
following physical properties: γ=1,55 t/m
3
; С=0,49 MPa;
=24°; b) gelatinegel ХС having the following characteristics:
mass concentration of gelatine 30% - γ=1,15 t/m
3
; С=72 MPa;
=25,5°, and at 15% - γ=1,078 t/m
3
; С=34,8 MPa;
=13,5°.
Value ξо for sand-oil mixture is set by pulling steel strips in a
tray filled with the material which is under study (Terzaghi
1961), equal ξо=0,75.
Models from sand and oil mixture have height
Н
=0,3 m,
width
L
=0,6 m, β=75
о
. They were loaded with uniformly
distributed load over the stamp which has the following
dimensions in plan 0,6
0,5 m, consistently placed at a distance
b
=0;0,25
H
;0,5
Н
from the edge of the escarpment. When
b
=0
the average value (based on 10 experiments) of the intensity of
the breaking load
q
р
=1,84
kPa
, when
b
=0,25
Н
-
q
р
=0,78
kPa
,
and when
b
=0,5
Н
-
q
р
=1,39
kPa
. Calculated safety factor
values for each of the three variants were found to be
К
1
=1,11;
К
2
=0,99;
К
3
=1,02. Evidently these values differs from limit
value K=1 for no more than 11%.
Models from gelatingel
ХС
formed in dismountable
container made of organic glass, in the same forms loading of
models up to failure was conducted, and at this moment loading
size was fixed. Safety factor values, calculated on the basis of
our proposals for the moment of destruction, were found to be
К
30%
=1,08 and
К
15%
=1,1, i.e. differ from the limiting value of
К
=1, on 8% and 10%.
Figure 1. Fragment of a design scheme and work diagrams of
restraining and shearing forces (plastic deformation areas are not
presented)


