1829
Technical Committee 205 /
Comité technique 205
Layer
Undrained
shear strength
[kPa]
Standard
deviation
SD [kPa]
Variation
coefficient
V
peat 1
12.8
2.40
0.19
peat 2
6.4
0.71
0.11
gyttja 1
7.7
1.12
0.15
gyttja 2 7.0
0.49
0.07
gyttja 3
7.5
0.92
0.12
Table 5. Mean values, standard deviations and variation coefficients of
undrained shear strength before the failure test at the Antoniny site. A -
under embankment crest, B - under embankment slope, C - outside of
embankment (Lechowicz 1992, Batory 2004).
Zone Layer
Undrained
shear strength
[kPa]
Standard
deviation
SD [kPa]
Variation
coefficient
V
peat 1
28.0
2.40
0.09
peat 2
24.5
0.71
0.03
gyttja 1
20.2
1.56
0.08
gyttja 2
18.7
1.38
0.07
A
gyttja 3
22.3
2.62
0.12
peat 1
18.0
1.40
0.08
peat 2
15.7
1.11
0.07
gyttja 1
13.2
2.12
0.16
gyttja 2
12.6
1.84
0.15
B
gyttja 3
13.4
1.29
0.10
peat 1
12.5
2.40
0.19
peat 2
7.7
0.73
0.09
gyttja 1
10.3
1.53
0.15
gyttja 2
9.9
1.23
0.12
C
gyttja 3
10.2
0.91
0.09
Undrained shear strength values obtained by the field vane
tests show a considerable increase in undrained shear strength
due to the loading and subsequent consolidation. The highest
strength increase was measured under the centre of the
embankment and the increase was most evident in the peat
layer. A smaller increase in undrained shear strength was
obtained under the slope of embankment, while the measured
shear strength values under the toes of slopes and outside the
embankment remained practically unchanged.
3.2 Statistical analysis of the field vane test results
The statistical analysis of the field vane test results was
performed to obtain mean values, standard deviations and
probability distribution. For statistical analysis of shear strength
normal distribution was used. Additionally, for comparison also
other type of statistical distribution were tested (Lechowicz et
al. 2004).
The statistical analysis was carried out using program
Statgraphics Plus 4.1 (Batory 2004). In this program goodness-
of-fit test is performing by the Kolmogorov-Smirnov test for a
95% confidence level.
The mean values, standard deviations and variation
coefficients of corrected shear strength for each geotechnical
layer are shown in Tables 4 and 5.
4
STABILITY ANALYSIS
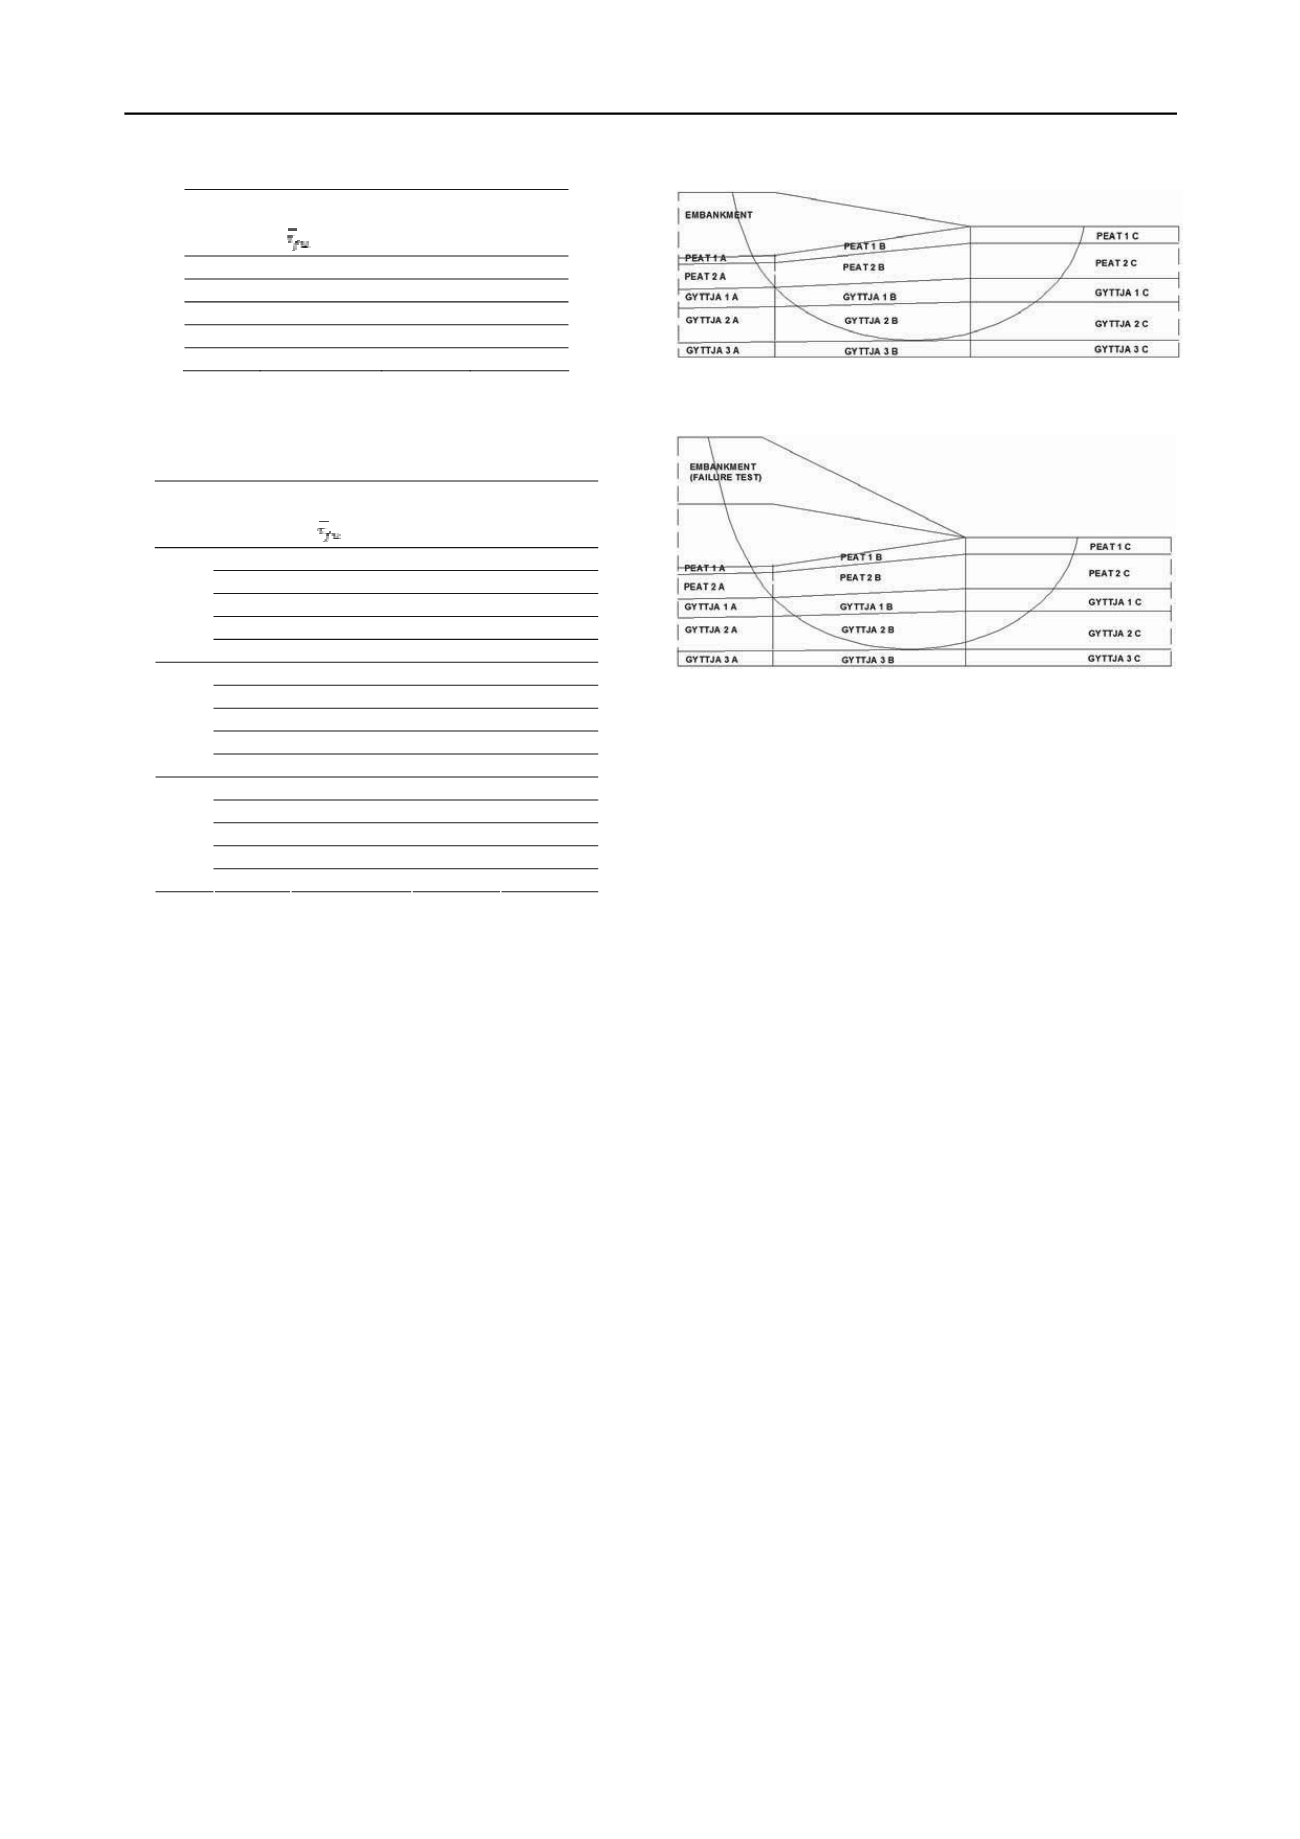
4.1 Selection of shear zones and design parameters
In stability analysis performed for the first stage the same
parameters for whole geotechnical layers were used. For the
third stage and the failure test the organic subsoil was divided
into three different shear zones: A - under embankment crest, B
- under embankment slope, C - outside of embankment.
Division of organic subsoil into shear zones is presented in
Figures 3 and 4.
Figure 3. Division of organic subsoil into shear zones for the third stage
at the Antoniny site.
Figure 4. Division of organic subsoil into shear zones for the failure test
at the Antoniny site.
In the stability analysis mean values of undrained shear
strength were used. The characteristic values of undrained shear
strength determined as mean values reduced by half and one
standard deviation were also used. In stability analysis design
values of undrained shear strength were received by using
partial factors (
) to mean and characteristic values.
M
In Design Approach DA1(C1) partial factor recommended
by Eurocode 7 is equal to 1.0 so values of design parameters
used in calculations are the same as characteristic ones. In
DA1(C2) and DA3 recommended partial factor (
M
) on
undrained shear strength is equal to 1.25, so design parameters
used in stability analysis are reduced by that factor.
4.2 Calculation results
The stability analysis was carried out for the first and the third
stage as well as for the failure test of the embankment at the
Antoniny site. The safety factor was calculated using the
GeoSlope program with the use of Bishop’s simplified method.
The calculations were performed according to Eurocode 7 using
Design Approaches: DA1(C1), DA1(C2), DA3 and also using
probabilistic method. The stability analysis was carried out for
subsoil divided into geotechnical layers and zones presented in
Figures 3 and 4. Results of stability analysis performed
according to Eurocode 7 of embankment at the Antoniny site
are shown in Table 6.
Calculations performed for the first stage of embankment at
the Antoniny site prove that the embankment was stable. Both
for calculations carried out according to Eurocode 7 and using
probabilistic method the safety factor was much higher than
required. For DA1(C1) safety factor was equal to 1.82 assuming
mean values while for DA1(C1) and DA3 was equal to 1.46.
For comparison, safety factor using probabilistic method and
normal distribution was equal to 1.52 assuming mean values of
undrained shear strength. In this case reliability index
= 4.7.
Using characteristic values of undrained shear strength
evaluated based on Schneider’s recommendation the safety
factor for DA1(C1) was equal to 1.71, and for DA1(C2) as well
as DA3 was equal to 1.39. For characteristic values reduced by
one SD the safety factor was equal to 1.60 for DA1(C1) and
1.28 for DA1(C2) as well as DA3. Obtained values are less than
permissible for this class of construction.


