1828
Proceedings of the 18
th
International Conference on Soil Mechanics and Geotechnical Engineering, Paris 2013
At this test site the embankment was constructed in three
stages on organic subsoil from 1983 to 1987. The structure was
then brought to failure by increasing the height of the fill
(Wolski et al. 1988, 1989). The schedule of construction is
presented in Figure 1.
Figure 1. Construction schedule of embankment at the Antoniny site
(Wolski et al. 1988).
At the Antoniny site the virgin subsoil consists of an
amorphous peat layer and a calcareous-organic soil layer called
“gyttja” underlain by a sand layer. The organic subsoil, 7.8 m
thick, consists of 3.1 m peat and a 4.7 m gyttja. The results of
the index properties of organic soils are summarized in Table 1
and Table 2. Based on the index properties the peat layer was
divided into two layers: the first one being fibrous peat from the
ground surface to depth 1.0 m and the second one amorphous
peat below 1.0 m to depth 3.1 m. The gyttja layer was divided
into three layers, the first one being calcareous-organic gyttja
extending from 3.1 m to 4.5 m and the second and third layer
calcareous gyttja from 4.5 m to 6.8 m and below 6.8 m,
respectively. The ground surface is covered with grass
vegetation. In the first layer of peat is an abundance of cracks
and root channels.
Table 1. Index properties of peat at the Antoniny site (Wolski et al.
1988, 1989).
Peat
Properties
Fibrous Amorphous
Water content w
n
[%]
420-450
310-340
Unit density ρ [t/m
3
]
1.05-1.1
1.05-1.1
Specific density ρ
s
[t/m
3
]
1.4
1.45
Liquid limit w
L
[%]
-
305-310
Organic content [%]
8-85
65-75
CaCO
3
content [%]
5-10
10-15
Table 2. Index properties of gyttja at the Antoniny site (Wolski et al.
1988, 1989).
Gyttja
Properties
Calcareous
-organic
Calcareous Calcareous
Water content w
n
[%]
130-140
105-110
110-115
Unit density ρ [t/m
3
]
1.25-1.30
1.35-1.40
1.40-1.45
Specific density ρ
s
[t/m
3
]
2.2
2.3
2.4
Liquid limit w
L
[%]
100-110
80-90
90-100
Organic content [%]
15-20
8-10
5-7
CaCO
3
content [%]
65-75
80-85
85-90
In the virgin subsoil the static ground water level was
present in peat layer at the depth of 0.2 m below the ground
surface. In the underlying sand at the 7.8 m depth the water
pressure is artesian and has been measured to correspond to a
water head of 1.0 to 1.5 meters above the ground surface. The
high ground water level, combined with the artesian pore water
pressure and with relatively low bulk densities of organic soils
resulted in the effective vertical stresses in organic soils being
only a few kPa and almost constant in depth.
The preconsolidation pressure obtained from oedometer
tests is higher than the initial values of effective vertical
stresses, which shows that organic soils are overconsolidated
with an overconsolidation ratio, OCR, decreasing from 5 to 2
with depth. However, in first stage the effective stress was only
smaller than the initial preconsolidation pressure. During staged
construction the effective vertical stress exceed the initial
preconsolidation pressure several times.
3
UNDRAINED SHEAR STRENGTH
3.1 Undrained shear strength from field vane tests
The field vane test is relatively simple and quick in situ method
of shear strength measurement of organic soils. In order to
evaluate undrained shear strength (τ
fu
) from vane shear tests, the
measured values of shear strength (τ
fv
) have to be corrected
using correction factor (μ).
In this paper the correction factors evaluated according to
Swedish Geotechnical Institute method (Larsson et al. 1984)
and average correction factors which was determined based on
laboratory tests: triaxial compression (TC), triaxial extension
(TE) and direct simple shear (DSS) (Lechowicz 1992). Values
of correction factors are shown in Table 3.
Table 3. Correction factors for field vane tests obtained at the Antoniny
site: μ(w
L
) – correction factor recommended by SGI, μ(lab) – correction
factor based on laboratory tests.
Type of soil
μ(w
L
) μ(lab)
Peat (0-3.1 m)
0.50
0.51
Gyttja 1 (3.1-4.5 m)
0.70
0.56
Gyttja 2 and 3 (4,5-7,8 m) 0.80
0.61
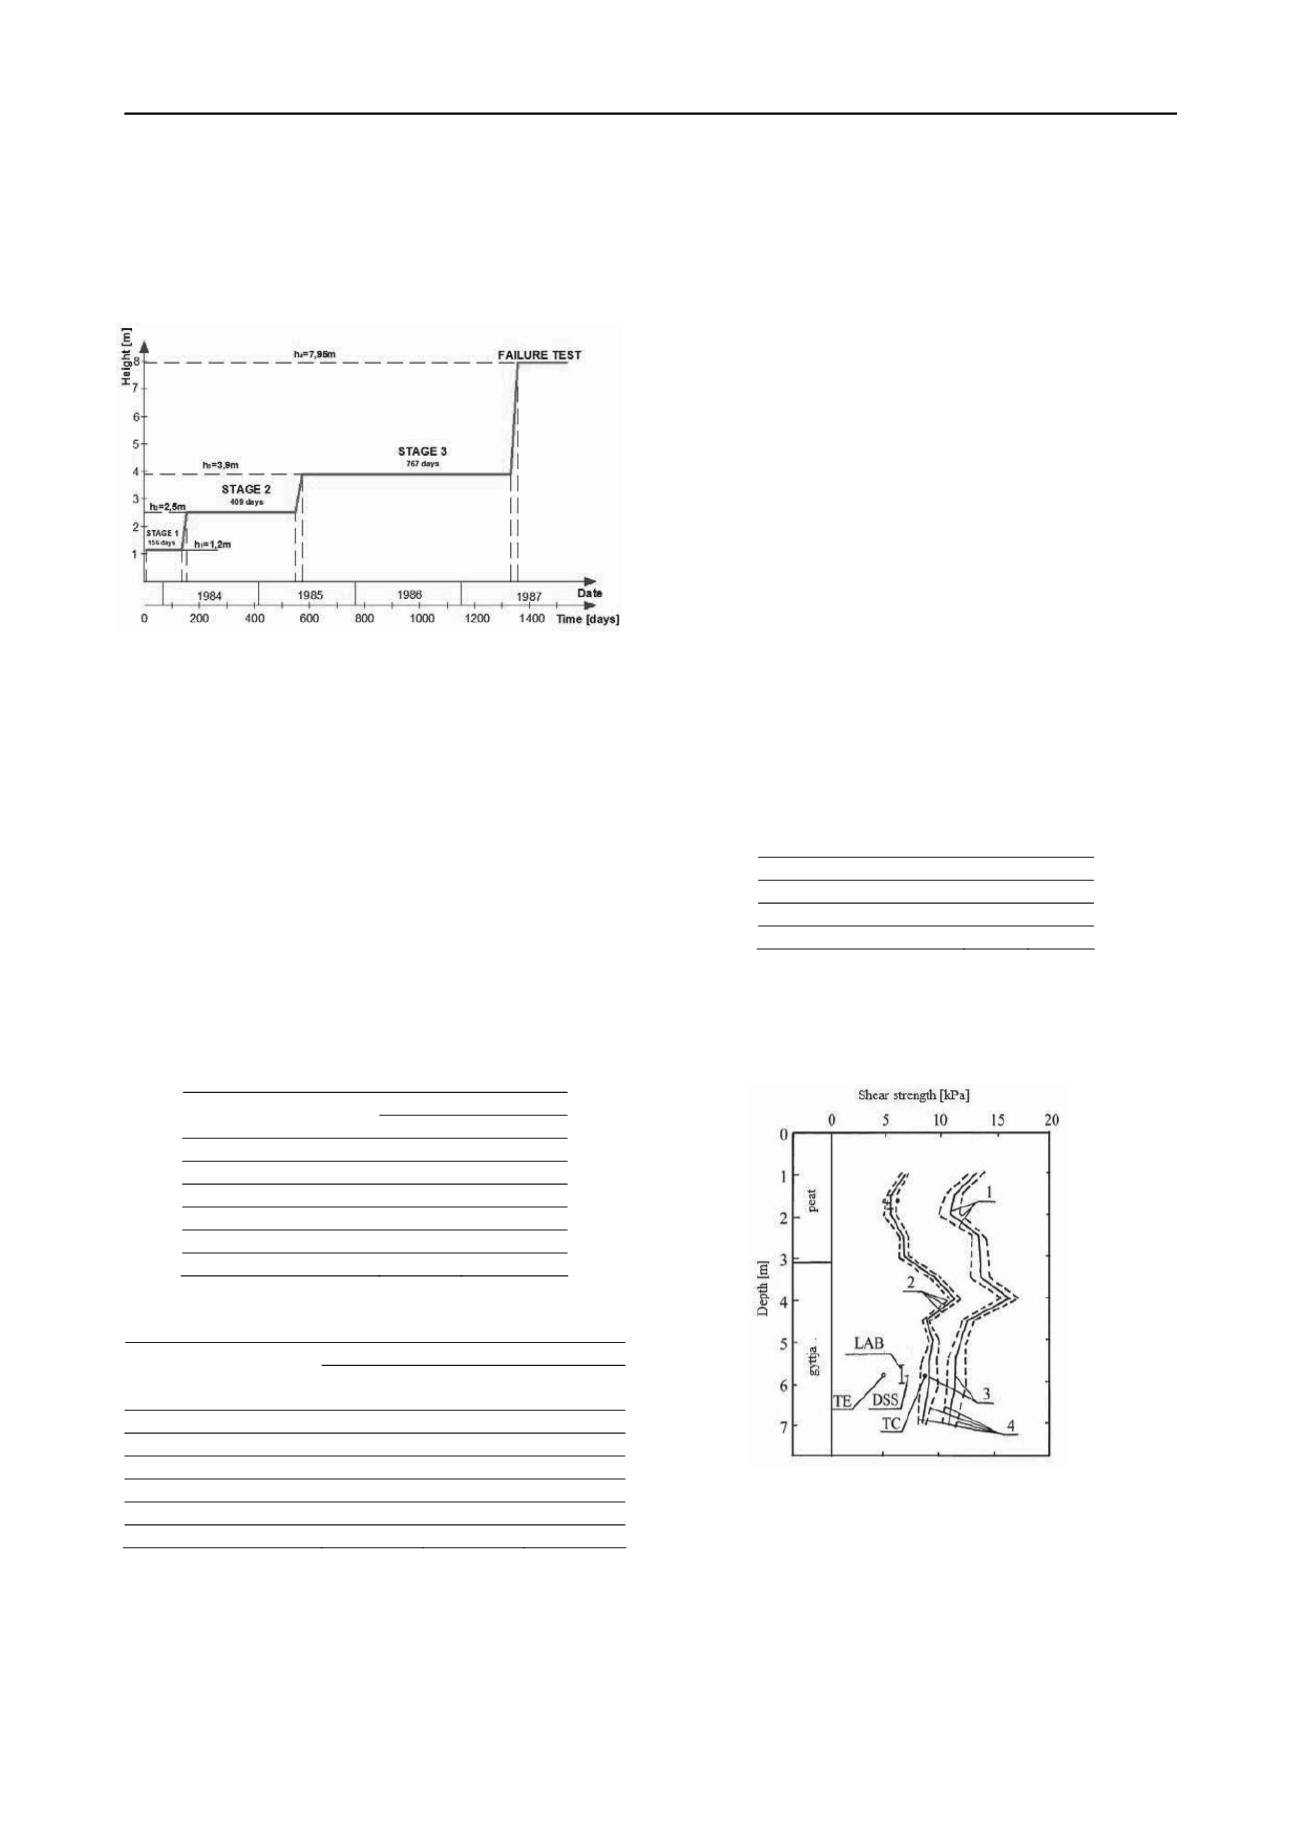
Mean values of corrected shear strength were calculated
based on early corrected values of measured shear strength.
Measured, corrected and mean values of undrained shear
strength in the virgin organic subsoil before loading are shown
in Figure 2.
Figure 2. Profile of undrained shear strength based on field vane tests at
the Antoniny site: 1 - results of field vane tests, 2 - values corrected
according to SGI, 3 - mean values, 4 - mean values ± standard
deviation; TC - triaxial compression test, TE - triaxial extension test,
DSS - direct simple shear test, LAB - mean value from laboratory tests.
Mean values of corrected shear strength (τ
fu
) in the virgin
organic subsoil before loading and in the consolidated organic
subsoil before failure test are presented in Tables 4 and 5.
Table 4. Mean values, standard deviations and variation coefficients of
undrained shear strength before loading at the Antoniny site (Lechowicz
1992, Batory 2004).


