1834
Proceedings of the 18
th
International Conference on Soil Mechanics and Geotechnical Engineering, Paris 2013
Proceedings of the 18
th
International Conference on Soil Mechanics and Geotechnical Engineering, Paris 2013
measurements. The coefficient of variation of the mean value
for the design parameter in a stratum with constant properties is
established from available measurements as:
̂ √
(3)
where
is the coefficient of variation of
,
is the
standard deviation of
,
is an empirical modifier to account
for the fact that
may be underestimated for small numbers
of tests, and
̂
is the standard deviation of the measurements.
Slightly different equations are used for strata where design
parameters are deemed to vary linearly with depth (MoDOT,
2010). Fig. 3 illustrates results of such calculations.
F
igure 3. Example “site model” developed for design of drilled shafts.
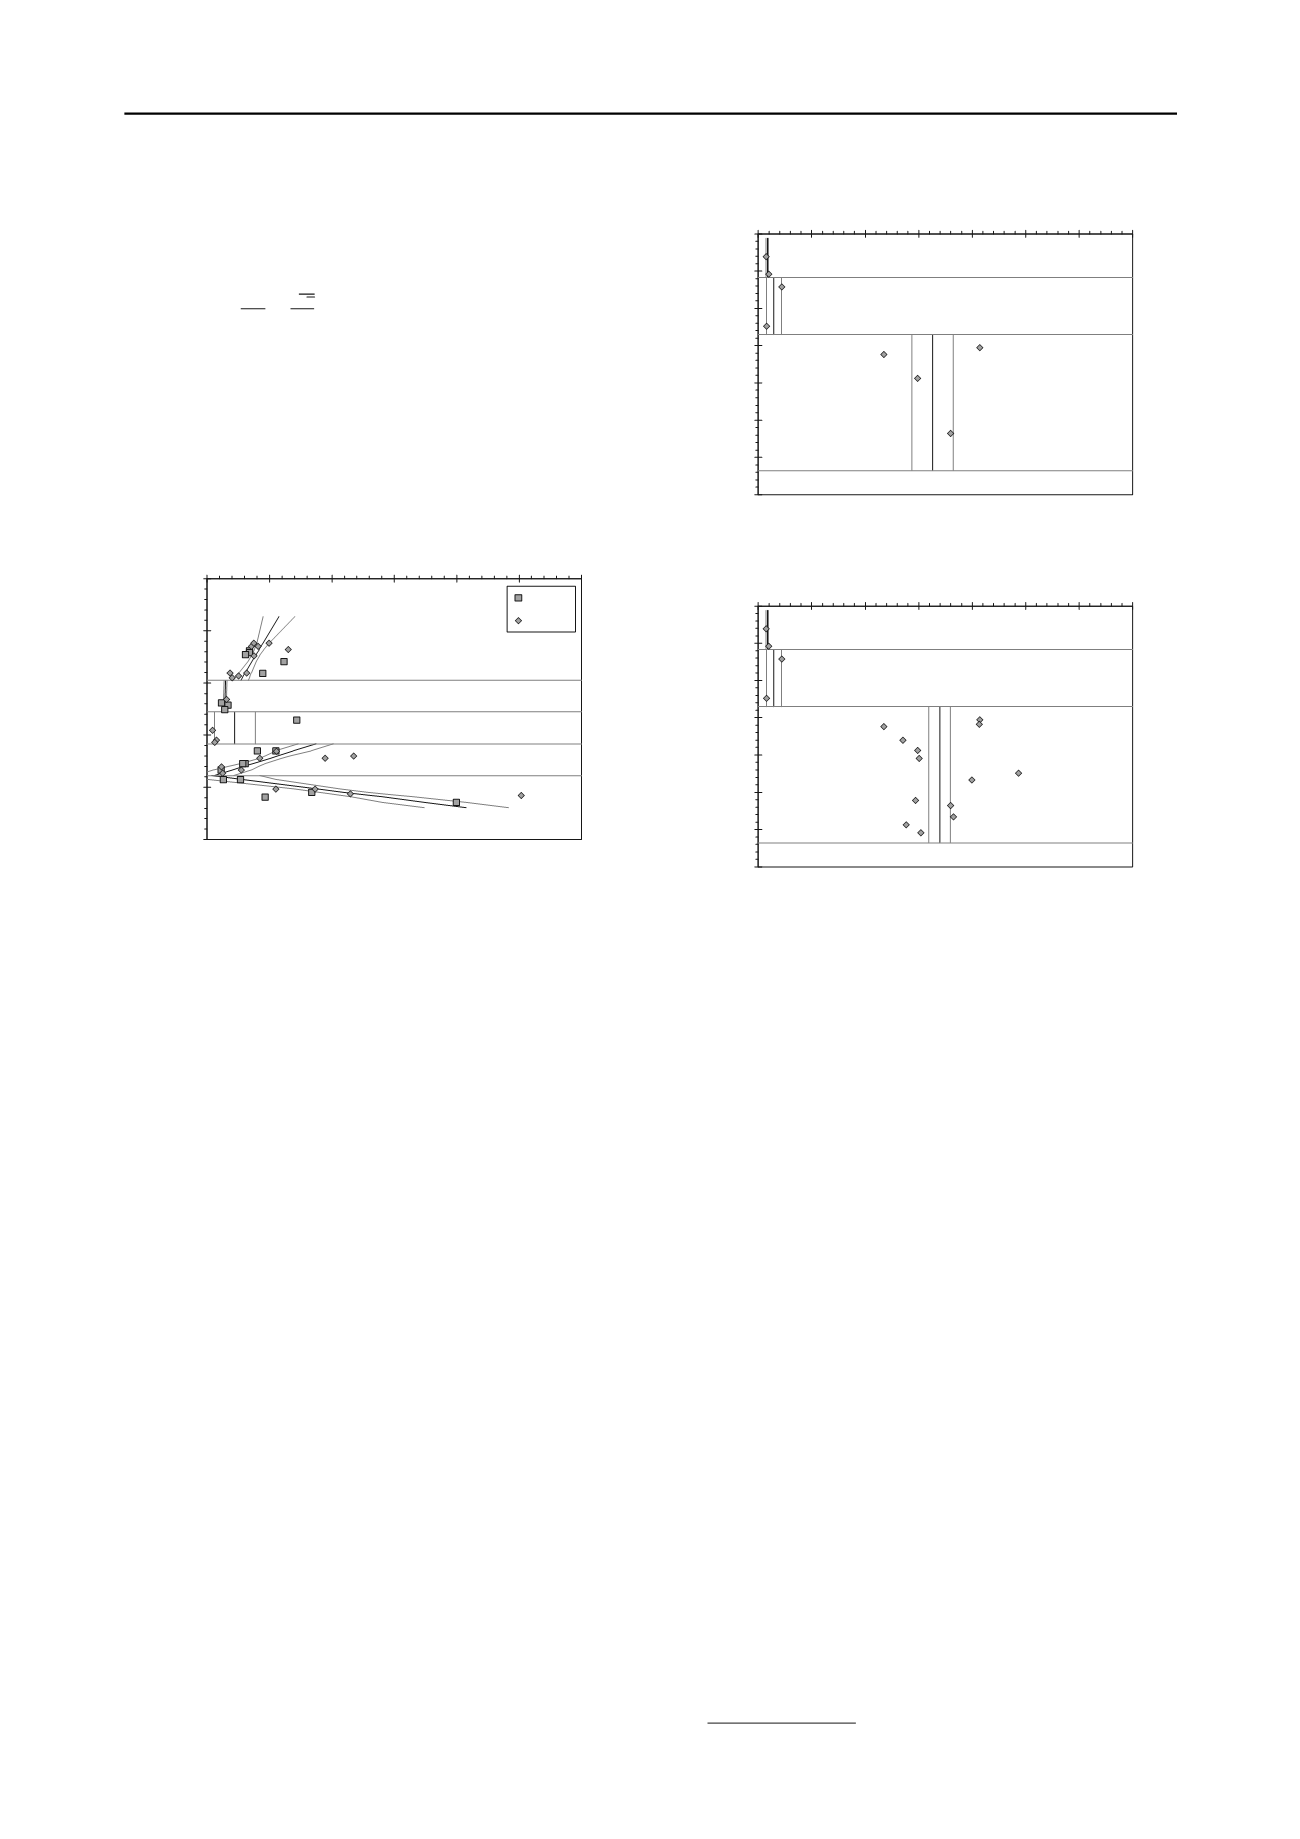
7 EXAMPLE APPLICATION
To illustrate how the methods described can be used to quantify
the potential value of site characterization activities, a
conceptual design of drilled shafts for a highway bridge was
conducted using measured values of uniaxial compressive
strength for a shale site. Two designs were completed: the first
using a small randomly selected subset of the available test
measurements (Fig. 4) to reflect design based on a limited site
investigation and testing program; the second was completed
using a larger subset of the available measurements (Fig. 5) to
reflect design based on a more typical site investigation for a
bridge design. As shown in the figures, the more extensive
investigation produces a slightly greater mean value for the
uniaxial compressive strength in Maquoketa Formation C, but
reduces the
of the mean value by a factor of two. This, in
turn, allows greater resistance factors to be used for design.
Considering the same 13 MN axial load for both designs, the
design completed based on the limited site investigation (Fig. 4)
leads to use of 7.5 m long, 1200 mm diameter drilled shafts
while the design completed based on the more typical site
investigation (Fig. 5) leads to use of 5 m long, 1200 mm
diameter drilled shafts. The estimated cost differences between
these two designs is approximately $5,000 per shaft. Thus, the
value of the additional testing is approximately $5,000 per shaft.
In practice, such direct comparisons are not possible
a priori
.
However, designers can estimate how increasing the number of
measurements will affect the
of design parameters to
develop estimates of potential costs savings as in the example.
The estimated cost savings can, in turn, inform judgement
regarding the scope of testing that may optimize final designs.
If costs for additional characterization are not commensurate
with estimated cost savings, then the additional characterization
should not be undert
aken as it is unlikely to “pay off”.
While
such estimation is unfamiliar
, it is likely that one’s judgment
regarding expected reductions in the
with additional
testing will improve with experience so that practices regarding
effective scoping of site investigations will improve over time.
Figure 4. Uniaxial compressive strength measurements from site
characterization with limited scope.
Figure 5. Uniaxial compressive strength measurements from more
extensive site characterization.
8 CONCLUSION
Variability and uncertainty attributed to design parameters and
due to design and construction methods can be practically
separated within an LRFD framework by using resistance
factors established as a function of the
of the design
parameter(s). Use of such resistance factors can improve the
efficiency of geotechnical designs by more precisely and
consistently achieving target probabilities of failure. This
implementation also provides means to practically quantify the
potential value of additional site characterization during design,
which can improve design decisions and help convince
owners/clients of the value of additional characterization.
9 ACKNOWLEDGEMENTS
The work presented was funded by MoDOT, The Center for
Transportation Infrastructure and Safety at Missouri S&T, and
the University of Missouri. Substantial in-kind support was
also provided by members of ADSC: The International
Association of Foundation Drilling. This support is gratefully
acknowledged. The opinions, findings, and recommendations
in this publication are not necessarily those of MoDOT or the
U.S. Federal Highway Administration. This document does not
constitute a standard, specification or regulation.
10 REFERENCES
AASHTO (2010),
AASHTO LRFD Bridge Design Specifications
, Fifth
Edition, American Association of State Highway and
Transportation Officials.
MoDOT (2010)
, “Guidelines for Estimation of Geotechnical Parameter
Values and Coefficients of Variation”,
Engineering Policy
Guidelines
, Section 321.3, Missouri Department of Transportation,
(accessed January 10, 2013)
.
160
165
170
175
180
185
0
5
10
15
20
25
30
Elevation (m)
Uniaxial Compressive Strength,
UCS
(MPa)
BoringB-1
BoringB-2
Stratum I
Stratum II
Stratum III
Stratum IV
m
UCS
=0.5
z
-85.6MPa
COV
UCS
=0.13
m
UCS
=1.4MPa
COV
UCS
=0.08
StratumV
m
UCS
=2.2MPa
COV
UCS
=0.74
m
UCS
=2.7
z
-441.6MPa
COV
UCS
=0.31
m
UCS
=1112.1-6.7
z
MPa
COV
UCS
=0.35
188
190
192
194
196
198
200
202
0
1
2
3
4
5
6
7
Elevation (m)
Uniaxial Compressive Strength,
UCS
(MPa)
MaquoketaFormation A
MaquoketaFormation B
MaquoketaFormation C
m
UCS
=170kPa
COV
model
= 0.14
m
UCS
=290kPa
COV
model
= 0.48
m
UCS
=3.3MPa
COV
model
= 0.12
188
190
192
194
196
198
200
202
0
1
2
3
4
5
6
7
Elevation (m)
Uniaxial Compressive Strength,
UCS
(MPa)
MaquoketaFormation A
MaquoketaFormation B
MaquoketaFormation C
m
UCS
=170kPa
COV
model
= 0.14
m
UCS
=290kPa
COV
model
= 0.48
m
UCS
=3.4MPa
COV
model
= 0.06


