1833
Technical Committee 205 /
Comité technique 205
Proceedings of the 18
th
International Conference on Soil Mechanics and Geotechnical Engineering, Paris 2013
alternative site characterization activities. In this way, the
opportunity to apply sound judgment remains, but it can be
made more knowledgeably and consistently.
In the context of the guidelines, the probabilities of failure
considered were epistemic, or “degree of belief” probabilities,
which reflect level of knowledge, rather than aleatory
probabilities that are related to actual performance. Thus, the
probabilities of failure considered are related to the level of
knowledge and confidence in the design input parameters and
design methods rather than an actual statement about
performance rates, although the two are clearly related.
5 CALIBRATION OF RESISTANCE FACTORS
Calibration of resistance factors to separate consideration of
variability and uncertainty in design and construction methods
from variability and uncertainty in design parameters requires
only minor changes to common procedures. The most
significant change is to use a performance function,
, of the
form:
( ) ( ̅
)
(1)
where
( )
is a deterministic design relation for geotechnical
resistance,
represents the probabilistic design input
parameter(s),
̅
is the mean value of the design input
parameter(s),
is the probabilistic live load effect,
is the
probabilistic dead load effect, and
( ̅
)
is a probabilistic
“model uncertainty” parameter
used to represent the bias,
variability and uncertainty attributed to design and construction.
( ̅
)
reflects the conditional variability of the design method
established from load tests, from numerical analyses, or based
on judgment, while
reflects the variability and uncertainty in
the design input parameter(s). For design methods without
substantial bias,
( ̅
)
is taken to have a mean value of 1.0 and
a distribution that reflects the variability of the design method.
Given the performance function for a specific design
method, calibrations are then performed for a range of assumed
coefficients of variation (
) for the design input
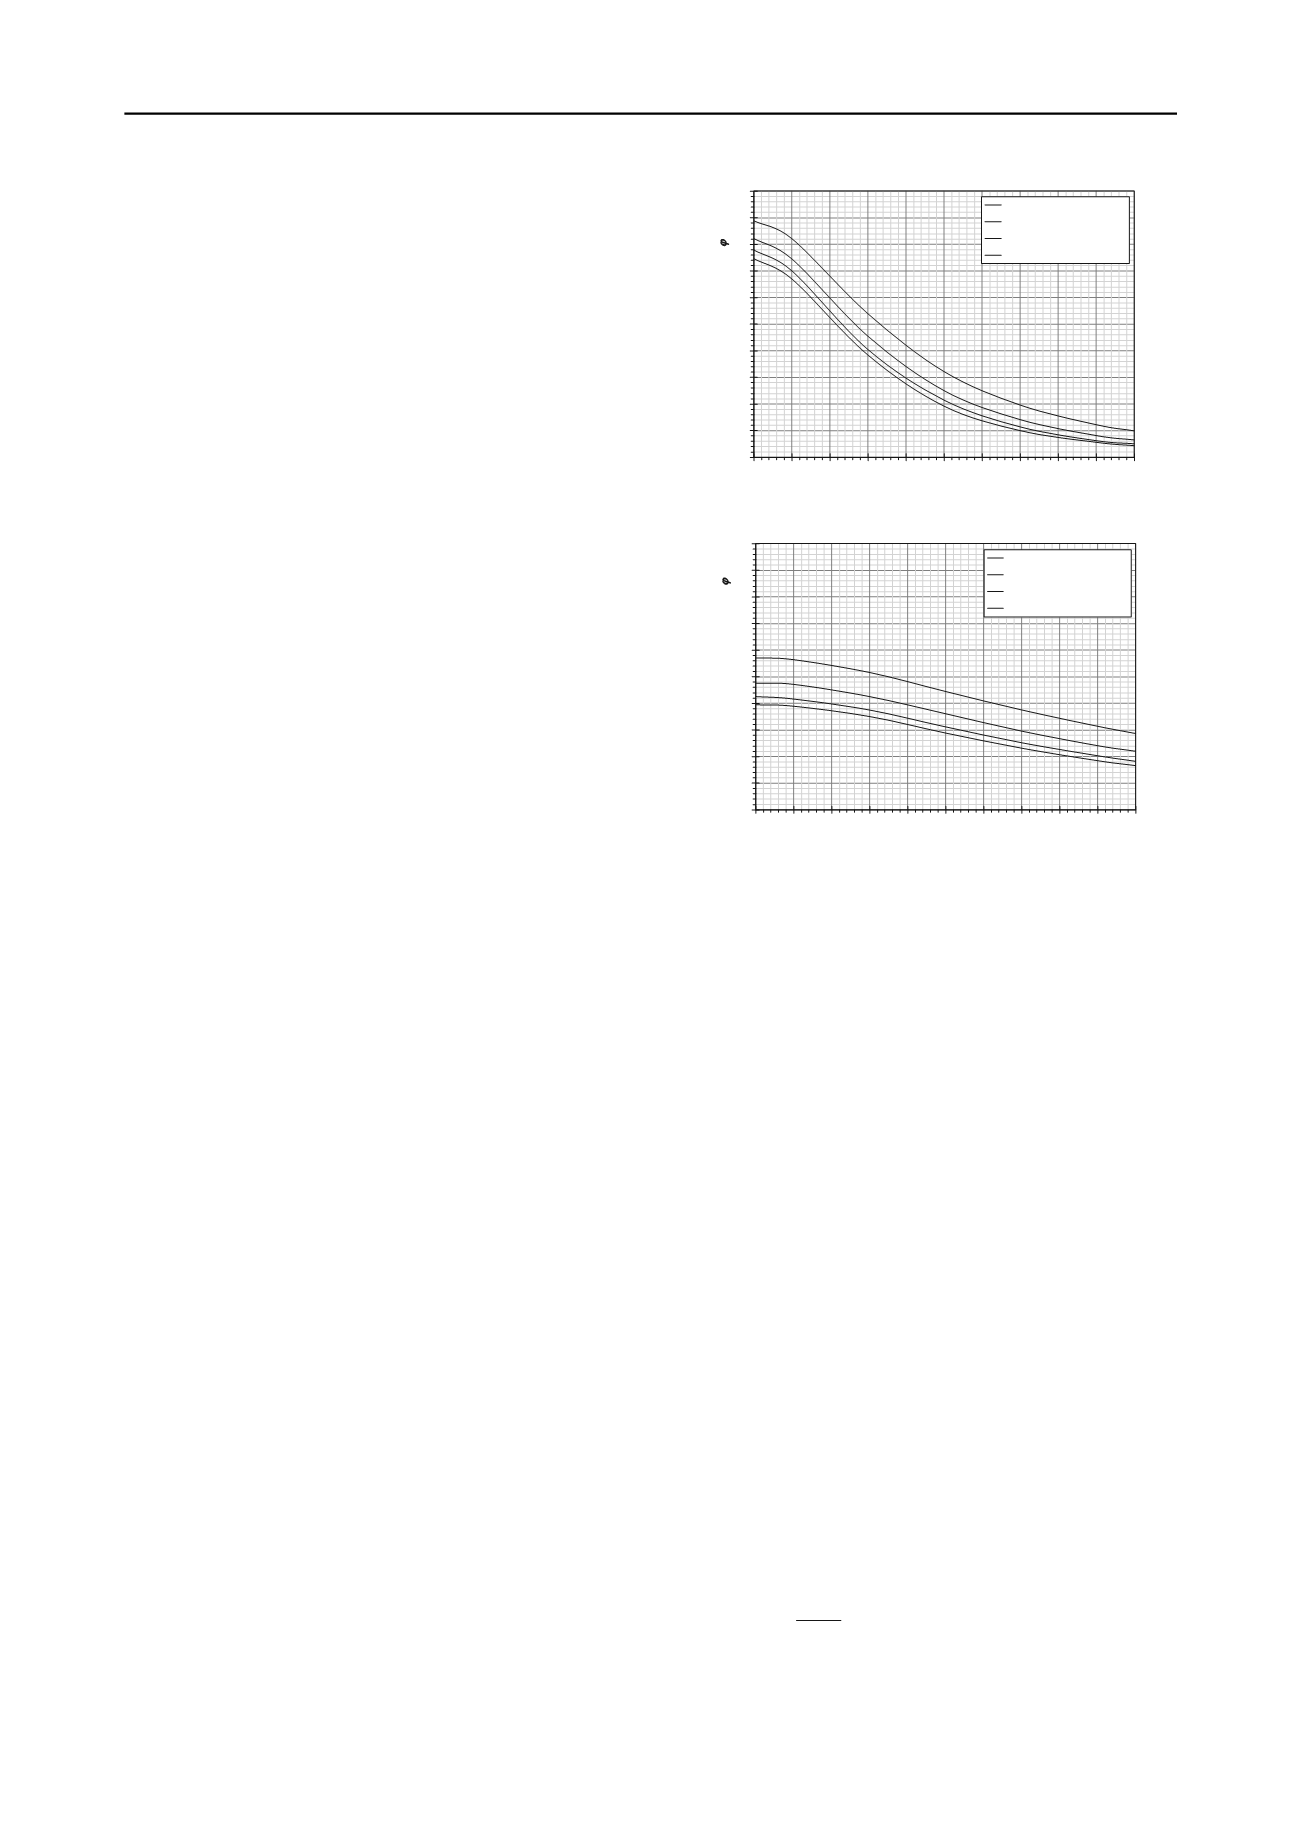
parameter(s). Figures 1 and 2 show results of calibrations
conducted for two illustrative design methods: design for tip
resistance of drilled shafts in clay and design for side resistance
of drilled shafts in rock, respectively. In each figure, curves are
shown for four categories of structures. Each of these curves
represents resistance factors to achieve a target probability of
failure established by agency policy. The curves reflect the
magnitude of resistance factor needed to achieve the target
probability of failure based on the variability and uncertainty
present in relevant input parameters, as represented by the
.
Simple observation of the curves shown in Figs. 1 and 2
provides valuable qualitative information regarding the
importance of site characterization for the respective design
methods. Comparison of resistance factors for
(corresponding to perfect information about the input
parameters) reveals that the variability and uncertainty
attributed to the method for side resistance in rock (Fig. 2) is
substantially greater than that for tip resistance in clay (Fig. 1).
Furthermore, the steepness of the curves in Fig. 1 indicate that
the resistance factor needed to achieve a given target probability
of failure is highly sensitive to the variability and uncertainty of
the undrained shear strength, thus indicating that the quantity
and quality of site characterization will have a substantial
impact on the resulting design. Conversely, the curves shown
in Fig. 2 are much flatter, indicating that reduction of the
for uniaxial compressive strength via expanded testing will have
a lesser effect on the resulting design. These simple qualitative
comparisons can also be quantified if specific values of
for
the design input parameters are estimated as will be illustrated
through a subsequent example.
Figure 1. Resistance factors for tip resistance in clay.
Figure 2. Resistance factors for side resistance in rock.
6 ESTIMATION OF PARAMETER UNCERTAINTY
Use of resistance factors established as described in the
previous section is straightforward once
-values for the
input parameters are known. The primary complication
introduced compared to current AASHTO specifications is that
the MoDOT guidelines require estimation of parameter
s.
Fortunately,
values can be established using practical
means that introduce little complexity to the design process.
The general approach to establishing
values closely
follows conventional procedures for interpretation of design
parameters. The process is based on establishing
a “design
profile” that reflects conditions present at a particular site.
These design profiles establish a “model” describing how the
magnitude of a design parameter varies with depth or elevation,
as well as the variability and uncertainty of the model.
For the MoDOT guidelines, design profiles are assumed to
be composed of a number of individual strata. The design
parameter within an individual stratum is assumed to have
values that are either constant, or linearly varying with depth or
elevation as illustrated in Figure 3. As a practical matter, any
design profile can be reasonably represented as some
combination of strata that have either a constant or linearly
varying property within each stratum. Regardless of whether
the parameter value is assumed to be constant or linearly
varying, the variability or uncertainty in the parameter within a
single stratum is assumed to be constant, and represented by a
constant value of the coefficient of variation (
).
Once individual strata are established, design values for
parameters in a stratum judged to have constant values are taken
to be the arithmetic mean of the available measurements:
̅
∑ ̂
(2)
where
is the
design, or “model” value of
the parameter,
̅
is
the mean value of the parameter measurements,
̂
is a
measured value of the parameter, and
is the number of
0.0
0.1
0.2
0.3
0.4
0.5
0.6
0.7
0.8
0.9
1.0
0.00 0.10 0.20 0.30 0.40 0.50 0.60 0.70 0.80 0.90 1.00
ResistanceFactor for TipResistance,
j
qp
COV of Mean Undrained Shear Strength,
COV
su
Bridgeson Minor Roads
Bridgeson Major Roads
Major Bridges (<$100million)
Major Bridges (>$100million)
0.0
0.1
0.2
0.3
0.4
0.5
0.6
0.7
0.8
0.9
1.0
0.00 0.10 0.20 0.30 0.40 0.50 0.60 0.70 0.80 0.90 1.00
ResistanceFactor for UnitSide Resistance,
j
qs
COV of Mean UniaxialCompressiveStrength,
COV
qu
Bridgeson Minor Roads
Bridgeson Major Roads
Major Bridges (<$100million)
Major Bridges (>$100million)


