1825
Technical Committee 205 /
Comité technique 205
loads are
γ
G
= 1 and
γ
Q
= 1.3. The load distribution for both
permanent and variable loads is assumed to be normal. The
variable load distribution is set at 50-year loads and the target
reliability corresponds to RC2 of the Eurocodes, i.e.
β
50
= 3.8.
The calculations are done for material variation of
V
M
= 0.1,
V
M
= 0.2 and
V
M
= 0.3. In addition a general uncertainty
following a normal distribution and 0.1 deviation is added into a
parallel calculation. The results of the calculations are shown in
Figure 2 as the function of the load ratio (the proportion of the
variable load in the total load, %).
Material factor
γ
M
load proportion Q/(G+Q) [%]
Figure 2. Material factors of the Eurocodes corresponding to
γ
G
= 1,
γ
G
= 1.3 and
β
50
= 3.8 as function of load ratio. The lowest, black lines
denote to
V
M
= 0.1; read lines, middle to
V
M
= 0.2 and blue lines, highest
to
V
M
= 0.3. The dotted lines correspond to values without uncertainty,
V
U
= 0 and the solid lines with uncertainty,
V
U
= 0.1.
The results presented in Figure 1 are of course dependent on the
assumptions made. It is though notable, that the material factors
are not constant while they depend on the load ratio. For an
independent load combination the material factors would also
be highly non-linear. The application of a constant material
factor as in EN 1997-1 does not thus result in a constant
reliability index. Considering effective stress analysis, the
variation of the parameter is according to data gathered by
Abramson et al. (2002) in the range of 2-21%. On average one
could use the value of 10 % corresponding to the black line in
Figure 2. The recommended partial safety factor for friction in
EN 1997-1 is 1.25, which corresponds to a load ratio of 60% in
Figure 2. Stability problems are often less load driven while in
some cases the external load has no significant effect on safety.
For such cases DA3 would according to Figure 2 clearly
overestimate the safety.
3.4
Calculated material factors for alternative approach
Next an alternative approach will be presented where all
uncertainty is placed on the material partial safety factor, i.e.
γ
G
=
γ
Q
= 1.0. In addition the material factors are calculated for
three different reliability index values, corresponding to the
three reliability classes in the Eurocodes. The target
β
values are
β
50
= 4.3 (RC3),
β
50
= 3.8 (RC2) and
β
50
= 3.2 (RC1).
Material factor
γ
M
a)
load proportion Q/(G+Q) [%]
Material factor
γ
M
b)
load proportion Q/(G+Q) [%]
Material factor
γ
M
c)
load proportion Q/(G+Q) [%]
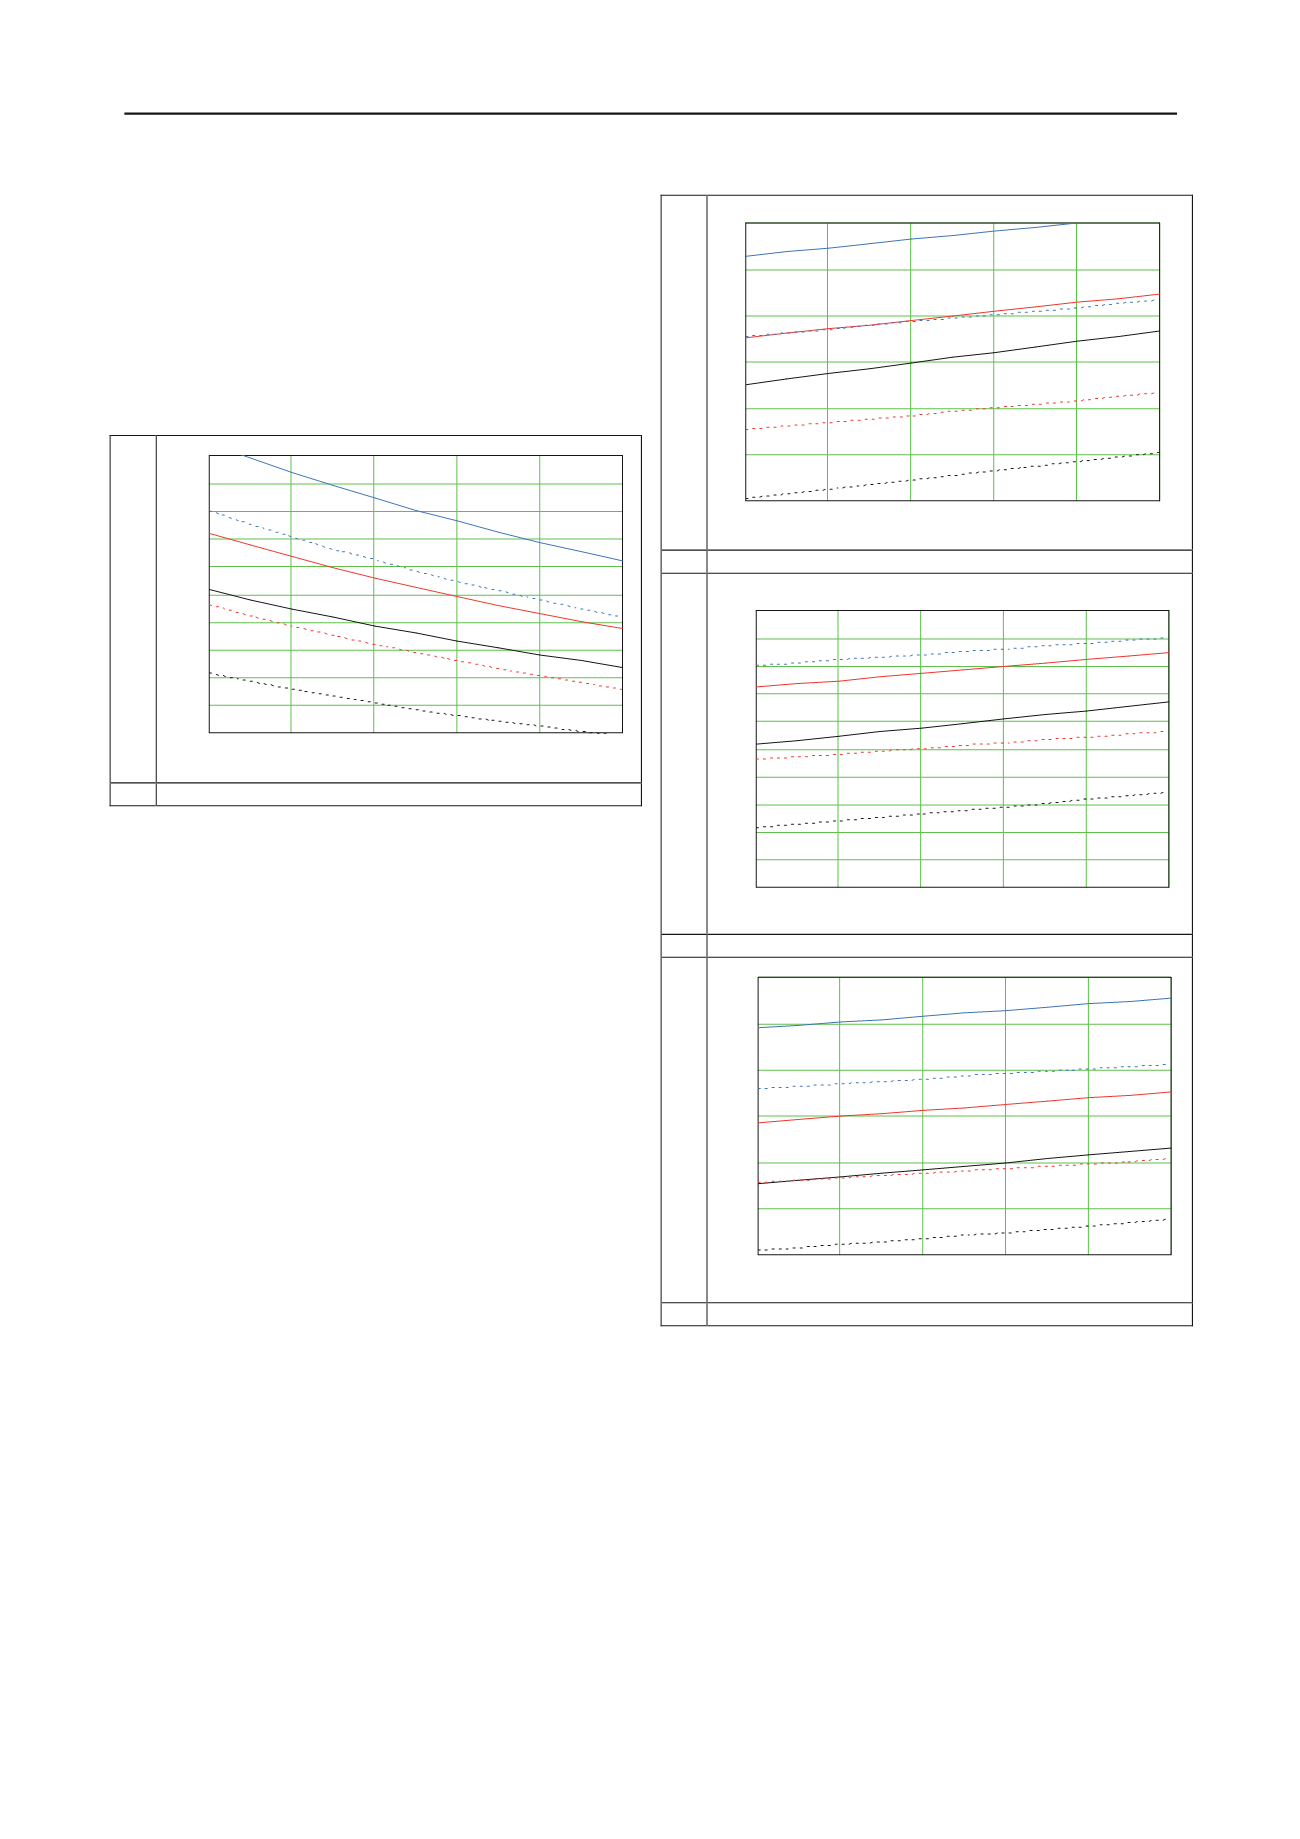
Figure 3. Material factors corresponding to
γ
G
=
γ
Q
= 1.0 and a)
β
50
= 4.3
(RC3), b)
β
50
= 3.8 (RC2) and c)
β
50
= 3.2 (RC1) as function of load
ratio. The lowest, black lines denote to
V
M
= 0.1; read lines, middle to
V
M
= 0.2 and blue lines, highest to
V
M
= 0.3. The dotted lines correspond
to values without uncertainty,
V
U
= 0 and the solid lines with
uncertainty,
V
U
= 0.1.
As can be seen, the material safety factors are the same as in
Figure 2 for equal reliability index when the load proportion is
zero. When Figure 2 and Figure 3 b are compared we find out
that an equal design outcome is obtained when the safety is set
both in the action and in the resistance or in the resistance only
(e.g. load proportion 60 %,
V
M
= 0.1, Figure 2:
γ
M
= .1.53, i.e.
(0.4+0.6
.
1.3)
.
1.53 = 1.81 which is equal to the value of Figure 3
b).
0
20
40
60
80
100
1.2
1.3
1.4
1.5
1.6
1.7
1.8
1.9
2
2.1
2.2
ii
ii
ii
ii
ii
ii
0
20
40
60
80
100
1.3
1.4
1.5
1.6
1.7
1.8
1.9
0
20
40
60
80
100
1.2
1.3
1.4
1.5
1.6
1.7
1.8
1.9
2
2.1
2.2
ii
ii
ii
ii
ii
ii
0
20
40
60
80
100
1.5
1.75
2
2.25
2.5
2.75
3


