1945
Technical Committee 207 /
Comité technique 207
assumption is conservative, since the predicted swell pressures
will be larger than the actual ones. The simplified linear model
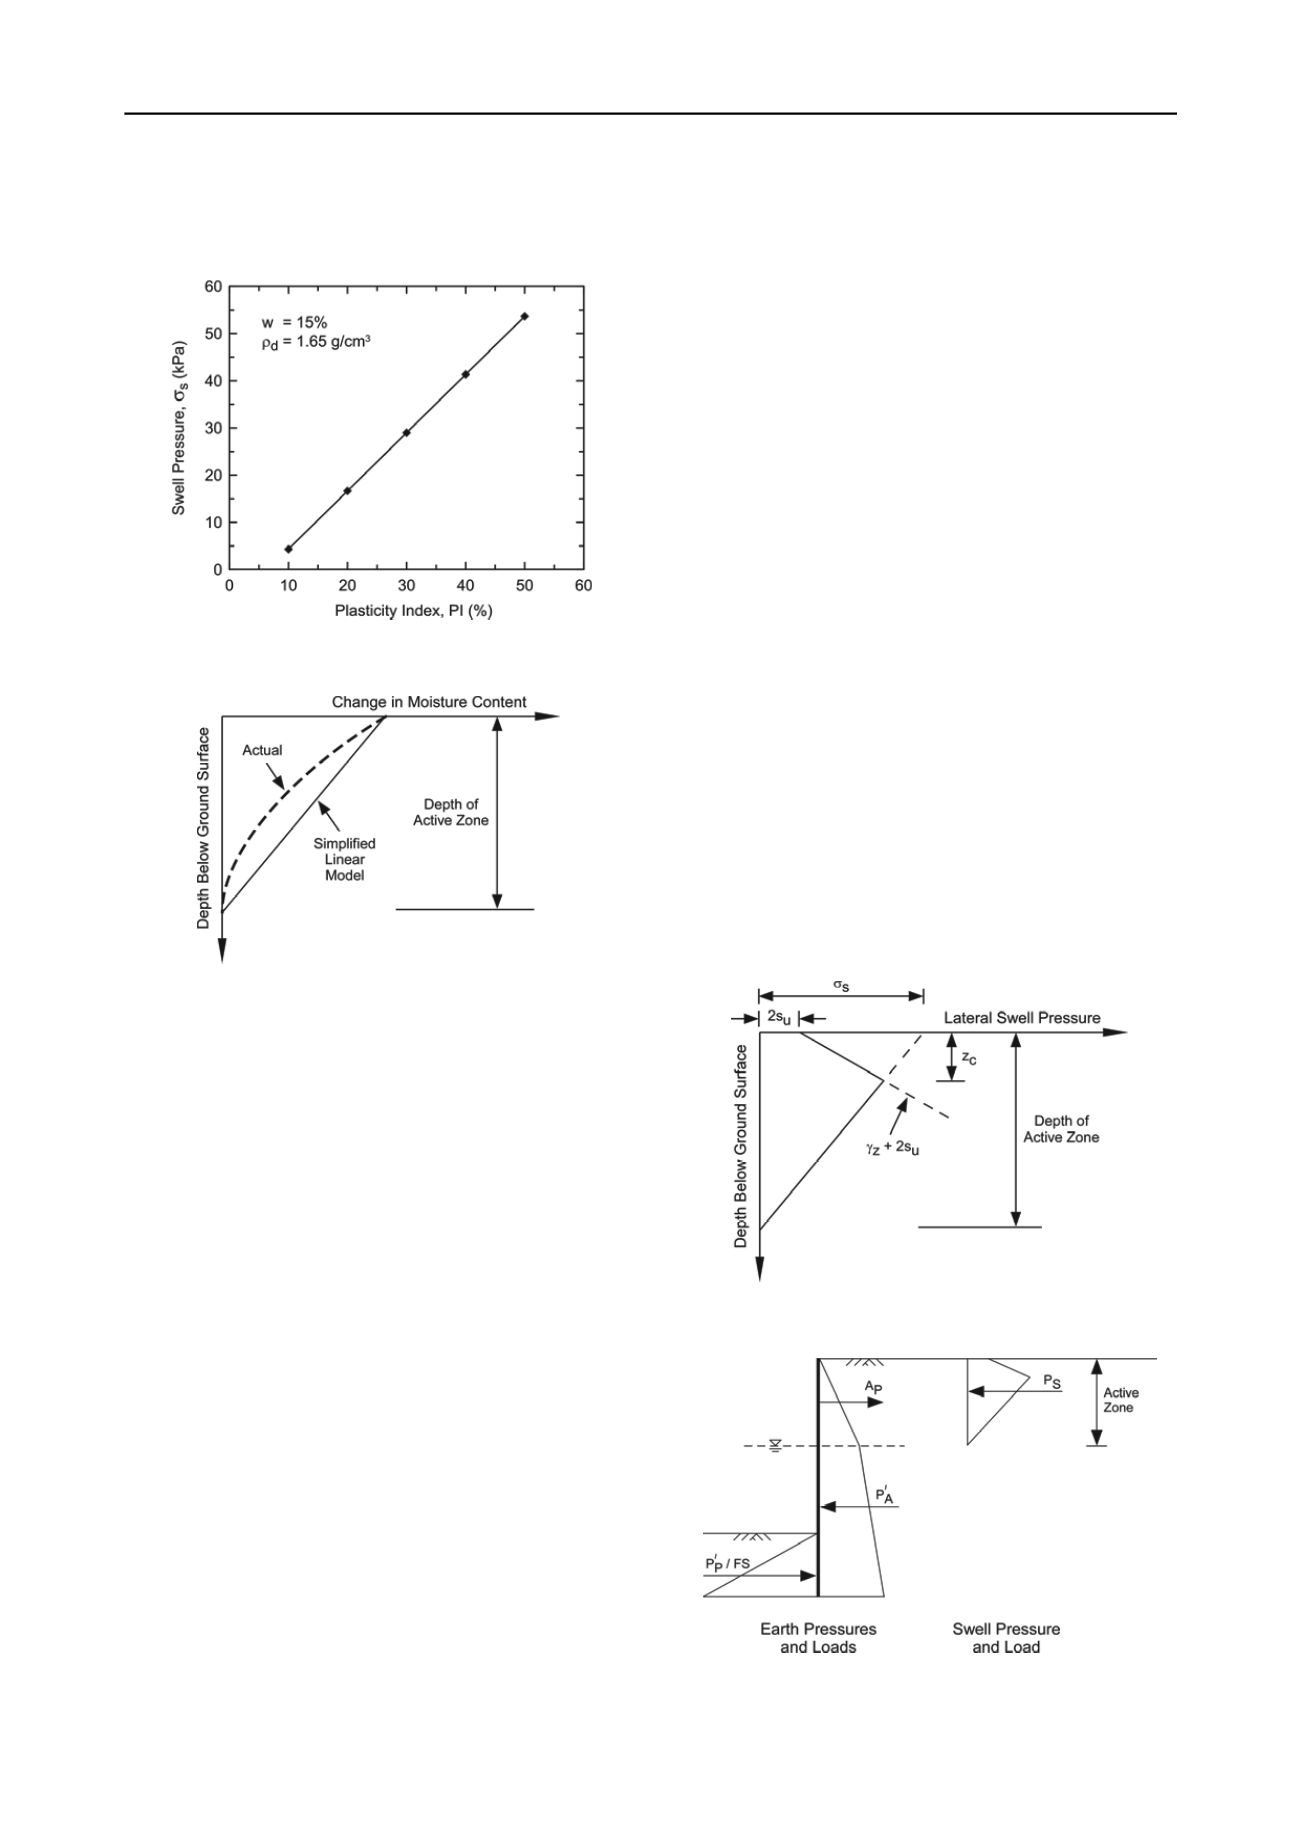
is shown in Figure 4.
Figure 3. Swell pressure versus plasticity index.
Figure 4. Change in moisture content with depth.
Because the change in moisture content causes the swelling
of expansive soils, swell pressure will be maximum at the
ground surface and will decrease as the depth increases. These
maximum pressures, i.e. potential swell pressures, can be
determined using Eq. 2. However, swell pressures close to the
ground surface will not reach their potential due to shallow
depths where soil confinement pressures are relatively lower.
Soils closer to the ground surface will be able to expand, and
full swell pressures determined by Eq. 2 will not be able to
develop. When swelling occurs, passive lateral earth pressure
conditions develop near the ground surface. Therefore, the
passive earth pressures can be used as an upper limit for swell
pressures near the ground surface. A schematic of the additional
lateral pressure developed behind the wall due to the swelling of
expansive soil is shown in Figure 5, where the potential swell
pressure,
s
, is determined by Eq. 2. When the swell pressures
exceed the passive earth pressures near the ground surface (i.e.,
within the critical depth,
z
c
, shown in Figure 5), the additional
lateral pressures due to the swelling of soil are capped by the
passive earth pressures.
4 ANALYSIS AND RESULTS
The analyses were performed for a fixed wall height of 10 m
with anchor level located at 2.5 m below the top of the wall.
The anchor level was selected based on a study performed by
Bilgin and Erten (2009) which showed that the best anchor
location to have minimum wall deformations was 0.25
H
below
from the top of wall, where
H
is the wall height. The active
zone depth used in the study was 5.0 m, selected based on the
values given by O’Neill and Poormoayed (1980) as mentioned
previously. The groundwater table is also assumed to be 5.0 m
below the top of wall and at the same elevation on both sides of
the wall. A schematic of the pressure diagrams used to perform
parametric study are shown in Figure 6.
The analysis results are shown in Figure 7 through Figure 9,
as a percent increase in the wall penetration depth, maximum
wall bending moment, and anchor force versus soil plasticity
index. The percent increase is given with respect to the baseline
case in which the anchored sheet pile wall was installed in non-
expansive soil. The results show that as the plasticity index
increases the wall penetration depth, maximum wall bending
moment, and anchor force can increase significantly.
4.1
Wall penetration depth
The effect of expansive soils and potential swell pressure,
calculated based on the soil plasticity index, on anchored sheet
pile wall penetration depth is presented in Figure 7. As shown
in Figure 7, an increase in the plasticity index, i.e. increase in
the activity of expansive soils, can result in significant increase
in wall penetration depth. Compared with the wall installed in
non-expansive soil, the wall penetration depth can increase
more than 85% and 125% for low and marginally expansive
soils, respectively. Within the plasticity index range considered
during this study, the wall penetration depth can increase as
much as 190% which is for the plasticity index of 50%.
4.2
Wall bending moment
The effect of expansive soils and potential swell pressures on
wall maximum bending moment is shown in Figure 8. The
results show that wall bending moment increases as the
plasticity index of soil increases. While the presence of
marginally expansive soils with fully reached swell potential
can result in approximately 105% increase in wall bending
moment, an increase of up to 170% can occur for soils with
plastic index values of 50%, i.e. highly expansive soils.
Figure 5. Lateral pressure distribution due to swelling of expansive soil.
Figure 6. Soil and swell pressures acting on the wall.


