1938
Proceedings of the 18
th
International Conference on Soil Mechanics and Geotechnical Engineering, Paris 2013
pressure was also performed to check results and it was found
that soil pressure were within 97% accuracy.
dz
ROTX d MX
)
(
(2)
dz
ROTX d QX
)
(
(3)
dz
ROTX d PX
)
(
(4)
4.2
6B
Pile Head Displacement.
Figure (4) shows a comparison for the measured pile head
displacement and that estimated from the present study. It is
noted that a very well agreement between the two curves is
existing where the R- squared value is 94%. The pile was just
instrumented on the top, thus diagram column represent one
case of loading.
0
2
4
6
8
10
12
1
2
3
4
5
6
7
8
9
10
Load case no.
Deflection(m)
Measured
Preent study
Figure (4) Predicted, and Measured Pile Head Deflection .
4.3
7B
Pile Straining Characteristics
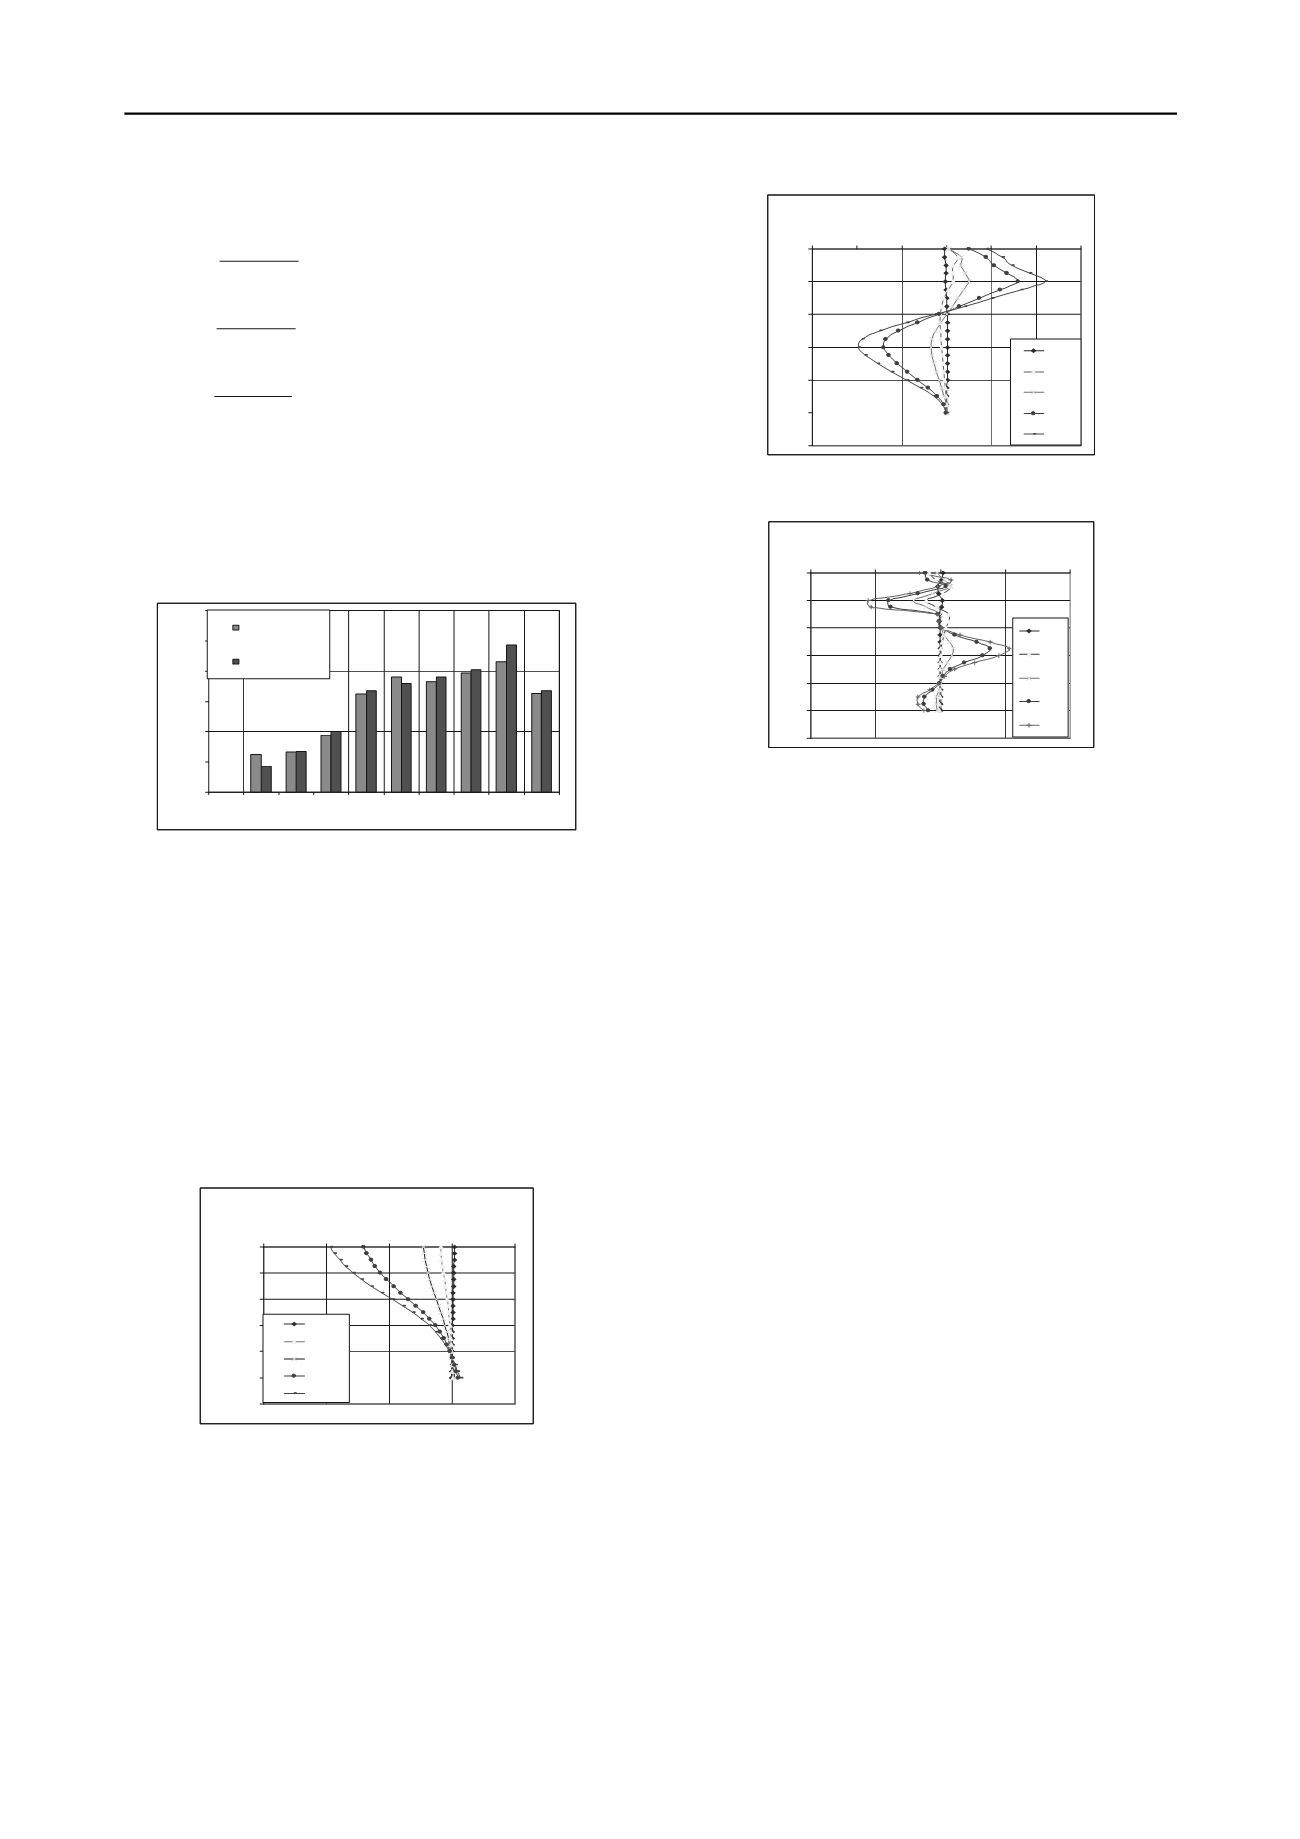
Figures (5- a) to (5-c ), show the lateral deflection (UYn),
bending moment (MYn), and soil reaction (pressure) (PYn)
respectively along Pile Shaft due to the decided loading
conditions illustrated in table (1). It is interesting to note that the
change in location of maximum bending moment, peak zones of
soil reactions, and points of hinges induced in different case of
loading, where the point of maximum moment changed from -3
m to -5 m in case of excavation to -2.5m and -4 m ,
respectively. The beak of soil resistance is observed at -3.0 m in
case of excavation to -2.5m and at -5.2 m in case of excavation
to -5m. Also, the point of reversing soil reaction was observed at
-7.75m.
0
2
4
6
8
10
12
-0.015 -0.01 -0.005
0
0.005
Deflection, UX, (m)
Depth,Z,(m)
UY2
UY3
UY4
UY6
UY8
Figure(5-a): Lateral Deflection along Pile Shaft .
0
2
4
6
8
10
12
-150 -100 -50
0
50 100 150
Bending Moment, MX,(KN.m)
Depth,Z,(m)
MY2
MY3
MY4
MY6
MY8
Figure (5-b): Bending Moment along Pile Shaft
0
2
4
6
8
10
12
-100
-50
0
50
100
Soil Reaction ,PX, (KN/m)
Depth,Z,(m)
PY2
PY3
PY4
PY6
PY8
Figure (5-c): Soil Reaction along Pile Shaft.
5.
8B
CONCLUSIONS
The main findings can be summarized as follows:
3D finite element model gives the possibility of
reaching high levels of loading until failure which is not
available in full scale load tests.
3D finite elements can compensate for performing full
scale lateral load tests with a good degree of trust to get reliable
behavior of pile under loads saving time, effort , and cost.
It is noted that good agreement between the measured
and estimated from results of the finite element model. It is very
important to obtain soil properties from high quality field or
laboratory tests, as these will have direct effect on the analysis
results.
Pile and soil geometries must also be determined to a
high degree of accuracy as these will also affect analysis
outcome. Remembering the adage in computer modelling.
6.
9B
REFERENCES
Abouzaid, K.S., Shaarawi, E., El-Ghamrawy, M., Tarek, M.F., and Bahr,
M.A
.
,(2010), " Three Dimensional Finite Element Model for a Laterally
Loaded Pile in Stiff Clay" Proc. 11th lnt Conf., Cairo, Egypt Vol.3, pp.
c34.
Alizadeh, M. and Lalvani, L. (2000), Lateral Load-Deflection Response
of Single Piles in Sand, Electronic Journal of Geotechnical Engineering.
Vol. 5.
Clark, J. I., Mckeown, S., Lester, W. B., and Eibner, L. J. (1985). “The
lateral load capacity of large diameter concrete piles.” 38th Canadian
Geotechnical Conference, Theory and Practice in Foundation
Engineering, Bolton, England.
Drucker, D.C. and Prager, W (1952), Soil Mechanics and Plastic
Analysis of Limit Design, Quart. Applied Mathematics, Vol. 10, No.2,
pp.157-165.
Jeremic, B., and Yang, Z (2002).Numerical analysis of pile behaviour
under lateral loads in layered elastic
–
plastic soils. International Journal
for Numerical and Analytical Methods in Geomechanics; 26:1385
–
1406
Maharaj, D. K. (2003), Load-Deflection Response of Laterally Loaded
Single Pile by Nonlinear Finite Element Analysis, Electronic Journal of
Geotechnical Engineering. Vol. 8, Bundle C,
H
Paper 03
H
42.


