1364
Proceedings of the 18
th
International Conference on Soil Mechanics and Geotechnical Engineering, Paris 2013
within the total thicknesses. Table 4 also shows that within
the chainage explored CBR values estimated were very high
and these were confined between the upper 35mm and
221mm of the 1.0m thick layer. This is an indication of high
blow counts as well as refusal to penetration.
Four plate loading tests were carried out within the
100m stretch. Results are presented in Figure 1. Generally,
the modulus of subgrade reaction (k
–
kN/m
3
) is the ratio of
loading stress (p) at 1.25mm average settlement to 1.25mm.
The loading stress is determined from the load
–
settlement
graph at average settlement of 1.25mm. It is observed from
Figure 1 that 3 out of 4 (75%) of the test did not attain the
1.25mm settlement criteria at the ultimate stress of 900kN/m
2
.
However at chainage 29+637, k value is estimated as
272MN/m
3
.This value may be considered as lower bound
value for the test section and gives an indication of very low
or negligible settlement of a compacted layer. The graphs also
indicate that no distinct shear failure occurred and so the final
load could be considered as the ultimate load. The finished
road of the trial section is presented in Figure 4.
Figure 2. Compacted shale at trial section
Figure 3. Plate load bearing test at trial section
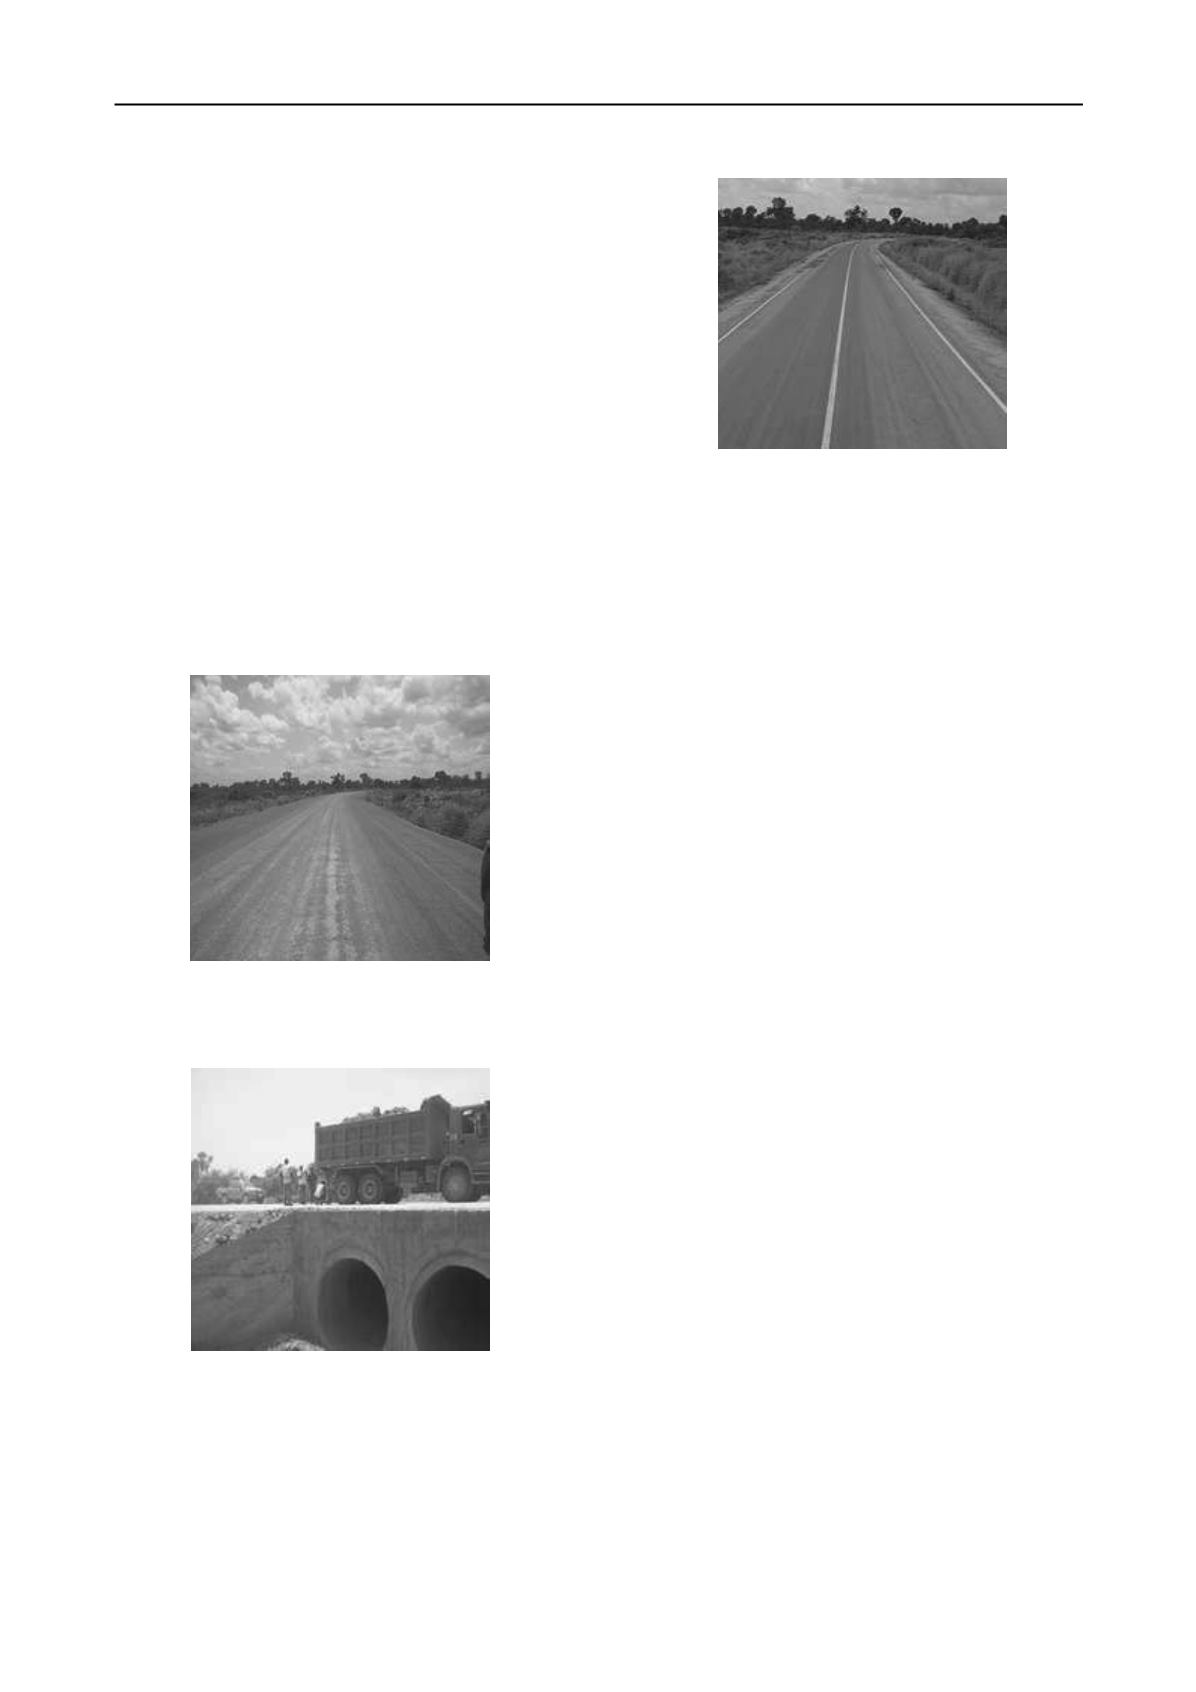
Figure 4. Finished road at trial section
2 CONCLUSIONS
The four day soaking CBR values from the laboratories were
below required specification. However field implementation
indicated a very good geotechnical strength measure for the
shale as fill and embankment material within the 100m test
section for the two months observations. The performance
characteristics of the shale encouraged its utilization as fill for
30km stretch of the road including a 2.0km length, 5m high,
of embankment. For nearly two and half years, including the
defect liability period, that the road has been in service there
has been continuous monitoring and observations. Pavement
failure indicators such as rutting and potholing have not been
observed as well as significant shear failures in embankments.
3 ACKNOWLEDGEMENT
The writers acknowledge Millennium Development
Authority, Ghana, the project implementation authority; the
project consultant, Gauff Ingenieure (GmbH); the six soil and
aggregate laboratories; the department of geology, University
of Ghana, Legon and Ghana Geological Survey Department.
The Ghana Geotechnical Society is also acknowledged for its
technical advice.
4
REFERENCES
Geological Survey Department. 2009. Geological map
explanation
–
map sheets 0601A/4, 0601B/3 & 0601D/1,
0601D/2 & 0601D/3. 115
–
117.
Sethi, S. and Schieber, J. 1998. Economic aspects of shales
and clays: an overview. Chapter 7. 14
Okogbue, C.O. and Aghamelu, O.P. 2010. Comparison of the
geotechnical properties of crushed shales from eastern
Nigeria. Bulletin of engineering geology and the
environment.


