 
          1363
        
        
          Technical Committee 202 /


            Comité technique 202


          Table 2. Summary of Petrographic thin section result on Afram Shale
        
        
          (Source: Department of Geology, Univ. of Ghana).
        
        
          Sample (%)
        
        
          Mineralogy
        
        
          1
        
        
          2
        
        
          Quartz
        
        
          60 - 70
        
        
          55 - 65
        
        
          Feldspar
        
        
          5 - 15
        
        
          10 - 20
        
        
          Clay
        
        
          10 - 20
        
        
          15 - 20
        
        
          Organic
        
        
          Nil
        
        
          Nil
        
        
          Table 3. Summary of X-ray fluorescence results based on major
        
        
          oxides. Source: Ghana Geological Survey Department
        
        
          Element
        
        
          Percentages
        
        
          Na
        
        
          2
        
        
          O
        
        
          1.39
        
        
          MgO
        
        
          1.52
        
        
          Al
        
        
          2
        
        
          O
        
        
          3
        
        
          8.57
        
        
          SiO
        
        
          2
        
        
          74.96
        
        
          Fe
        
        
          2
        
        
          O
        
        
          3
        
        
          2.63
        
        
          CaO
        
        
          0.26
        
        
          others
        
        
          2.57
        
        
          L.O.I
        
        
          8.10
        
        
          1.1.3


            Field test


          The field test carried out on the 100m stretch were the
        
        
          dynamic cone penetrometer (DCP) based TRRL specification
        
        
          and plate load bearing based on BS 1377:part9 1990
        
        
          A total of eight (8) test points were carried out for the
        
        
          DCP between chainage 29+662 and 29+712. Summary of
        
        
          results is presented in Table 4.
        
        
          Table 4. Summary of DCP test results
        
        
          Chainage
        
        
          Thickness,
        
        
          mm
        
        
          Ave CBR, %
        
        
          29+625
        
        
          131
        
        
          150
        
        
          29+637
        
        
          43
        
        
          150
        
        
          29+650
        
        
          103.5
        
        
          140.42
        
        
          29+662
        
        
          35
        
        
          150
        
        
          29+675
        
        
          221
        
        
          130.33
        
        
          29+687
        
        
          154
        
        
          150.14
        
        
          29+700
        
        
          69.8
        
        
          150
        
        
          29+712
        
        
          73.5
        
        
          145.07
        
        
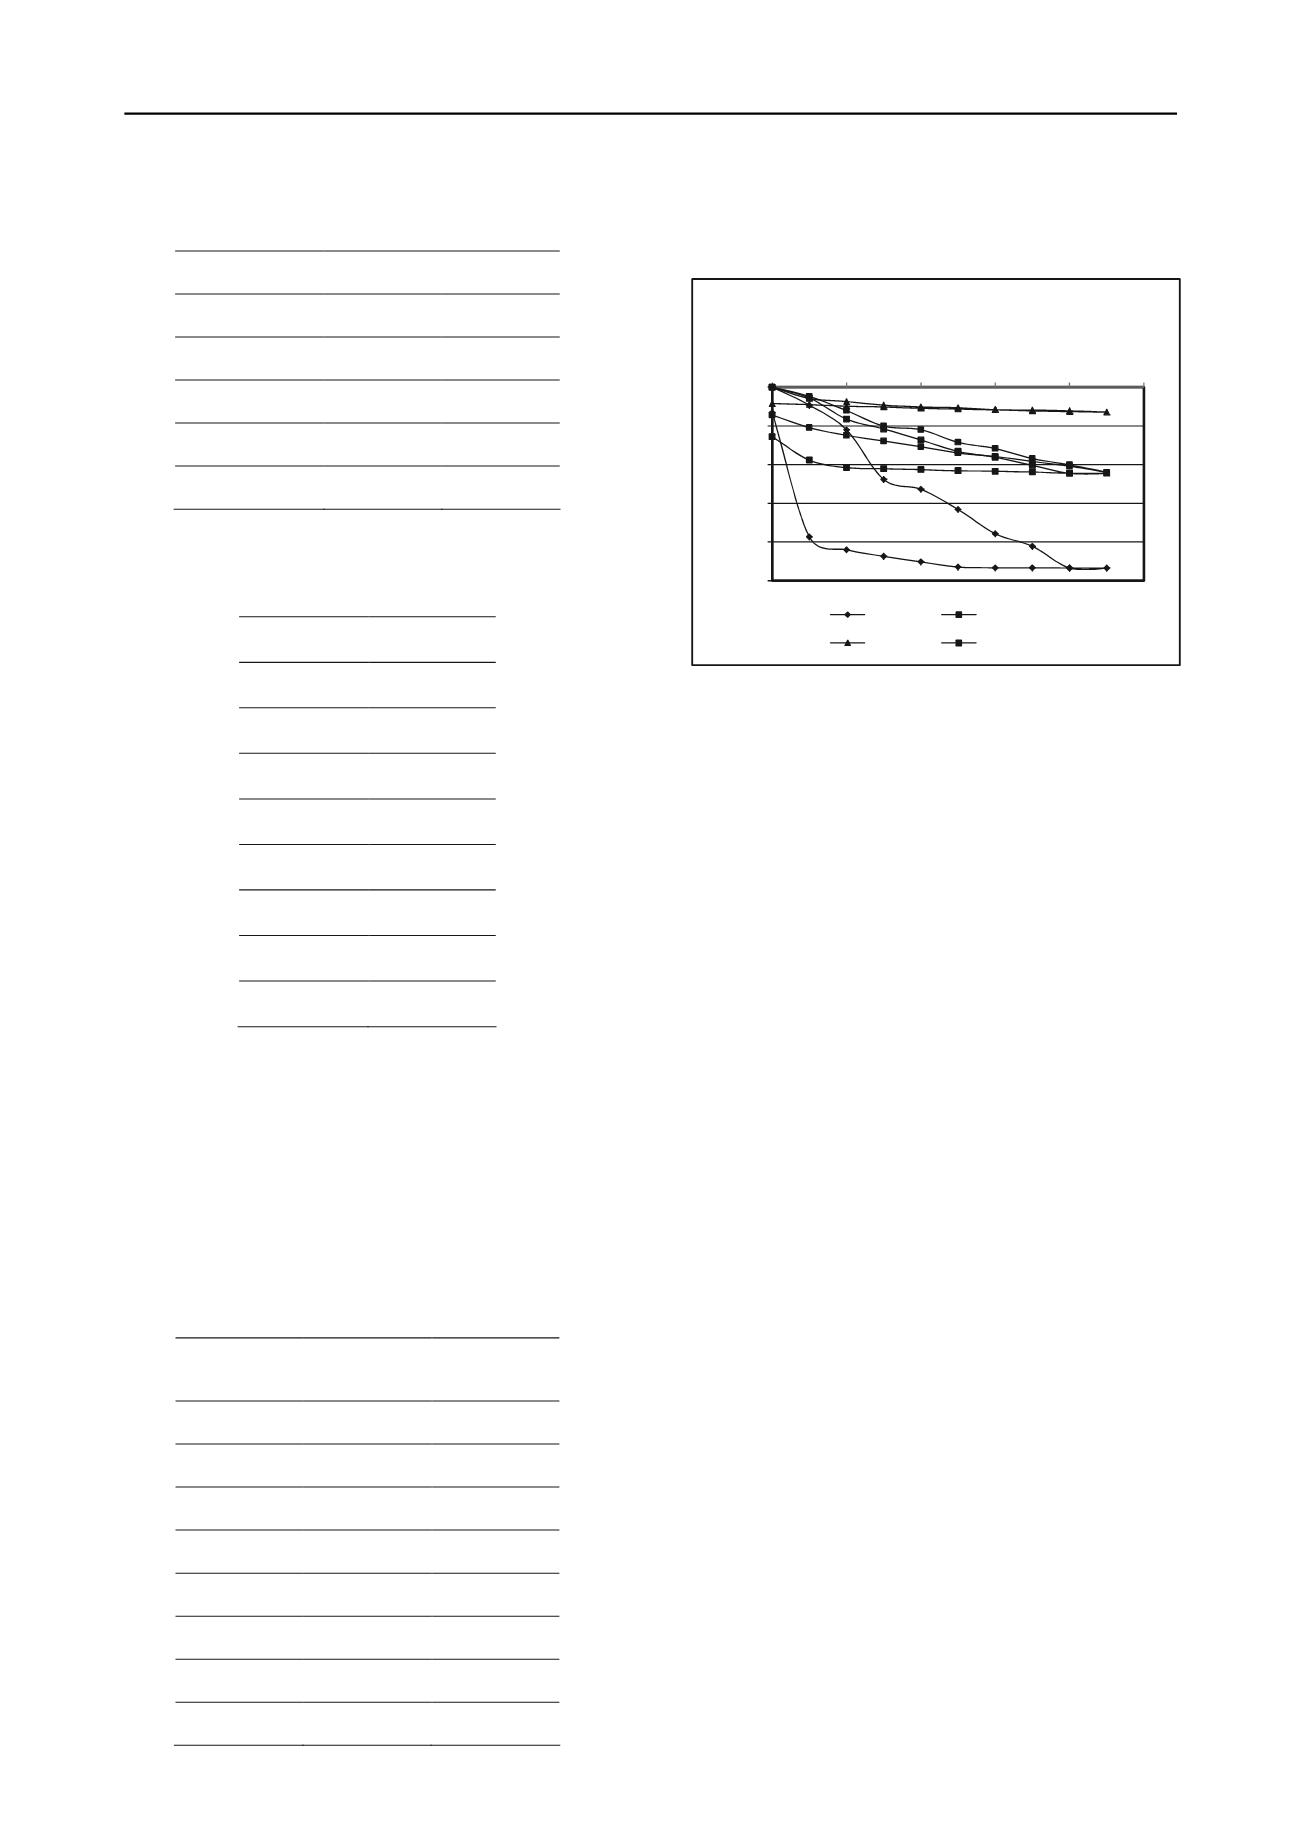
          Graphical presentation of plate load bearing test and typical
        
        
          field test performance are shown in Figure 1 and Figure 3
        
        
          respectively.
        
        
          0
        
        
          0.5
        
        
          1
        
        
          1.5
        
        
          2
        
        
          2.5
        
        
          0
        
        
          200
        
        
          400
        
        
          600
        
        
          800
        
        
          1000


            Average settlement, mm


            Bearing Pressure, kN/m


            2


            Load - settlement curves for plate bearing test


          Ch29+637
        
        
          Ch29+662
        
        
          Ch29+675
        
        
          Ch29+712
        
        
          Figure 1. Plate load bearing graphs
        
        
          1.1.4


            Discussion


          For quality assurance and statistical representation purposes,
        
        
          the shale was tested in six different laboratories to evaluate its
        
        
          geotechnical properties in order to understand its intended
        
        
          utilization. The conventional laboratory tests that are
        
        
          normally used for classifying materials in pavement works
        
        
          are gradation, Atterberg’s limits, plasticity modulus and CBR.
        
        
          Atterberg’s limits results
        
        
          , in Table 1, indicate that fine
        
        
          content is mostly clay and inorganic of low to medium
        
        
          plasticity. The plasticity modulus (PM) as per the contract
        
        
          specification stated that values of, at most, 200 are assigned
        
        
          as base course; those between 200 and 250 are assigned sub-
        
        
          base course. The PM values obtained from the laboratories
        
        
          varied between 13.7 and 461.7. These observed values
        
        
          indicate that the shale could be used as base, sub-base and fill
        
        
          materials. The CBR, four day soaking, values obtained range
        
        
          between 8% and 12%, which falls below the expected 15%
        
        
          contract specification for fill.
        
        
          During the construction stages an exposed section of the
        
        
          shale material on the road corridor, under traffic and
        
        
          environmental conditions, gave an interesting outlook. This
        
        
          prompted the implementation and evaluation of the trial
        
        
          section using conventional road construction methods.
        
        
          From Table 2, the petrographic analyses revealed that
        
        
          the subject material is mostly siliceous. The study revealed
        
        
          that the quartz had been re-worked, an indication of a
        
        
          transported clastic sediment or an occurrence of a low grade
        
        
          metamorphism of the material. The high SiO
        
        
          2
        
        
          content of
        
        
          about 75% shown in Table 3 and the low clay content indicate
        
        
          the siliceous nature of the shale material.
        
        
          The eight DCP test points were selected randomly within
        
        
          the 100m stretch. CBR values were obtained using the Kleyn
        
        
          and Van Harden equation below.
        
        
          Log (Cbr) = 2.628
        
        
          –
        
        
          1.273log (DCP)
        
        
          Table 4 presents the DCP test results varying thicknesses for
        
        
          CBR evaluation. The thickness column, in the Table 4,
        
        
          represents total thicknesses run-by each DCP test at the
        
        
          various chainage. CBR values represent average values