1359
Technical Committee 202 /
Comité technique 202
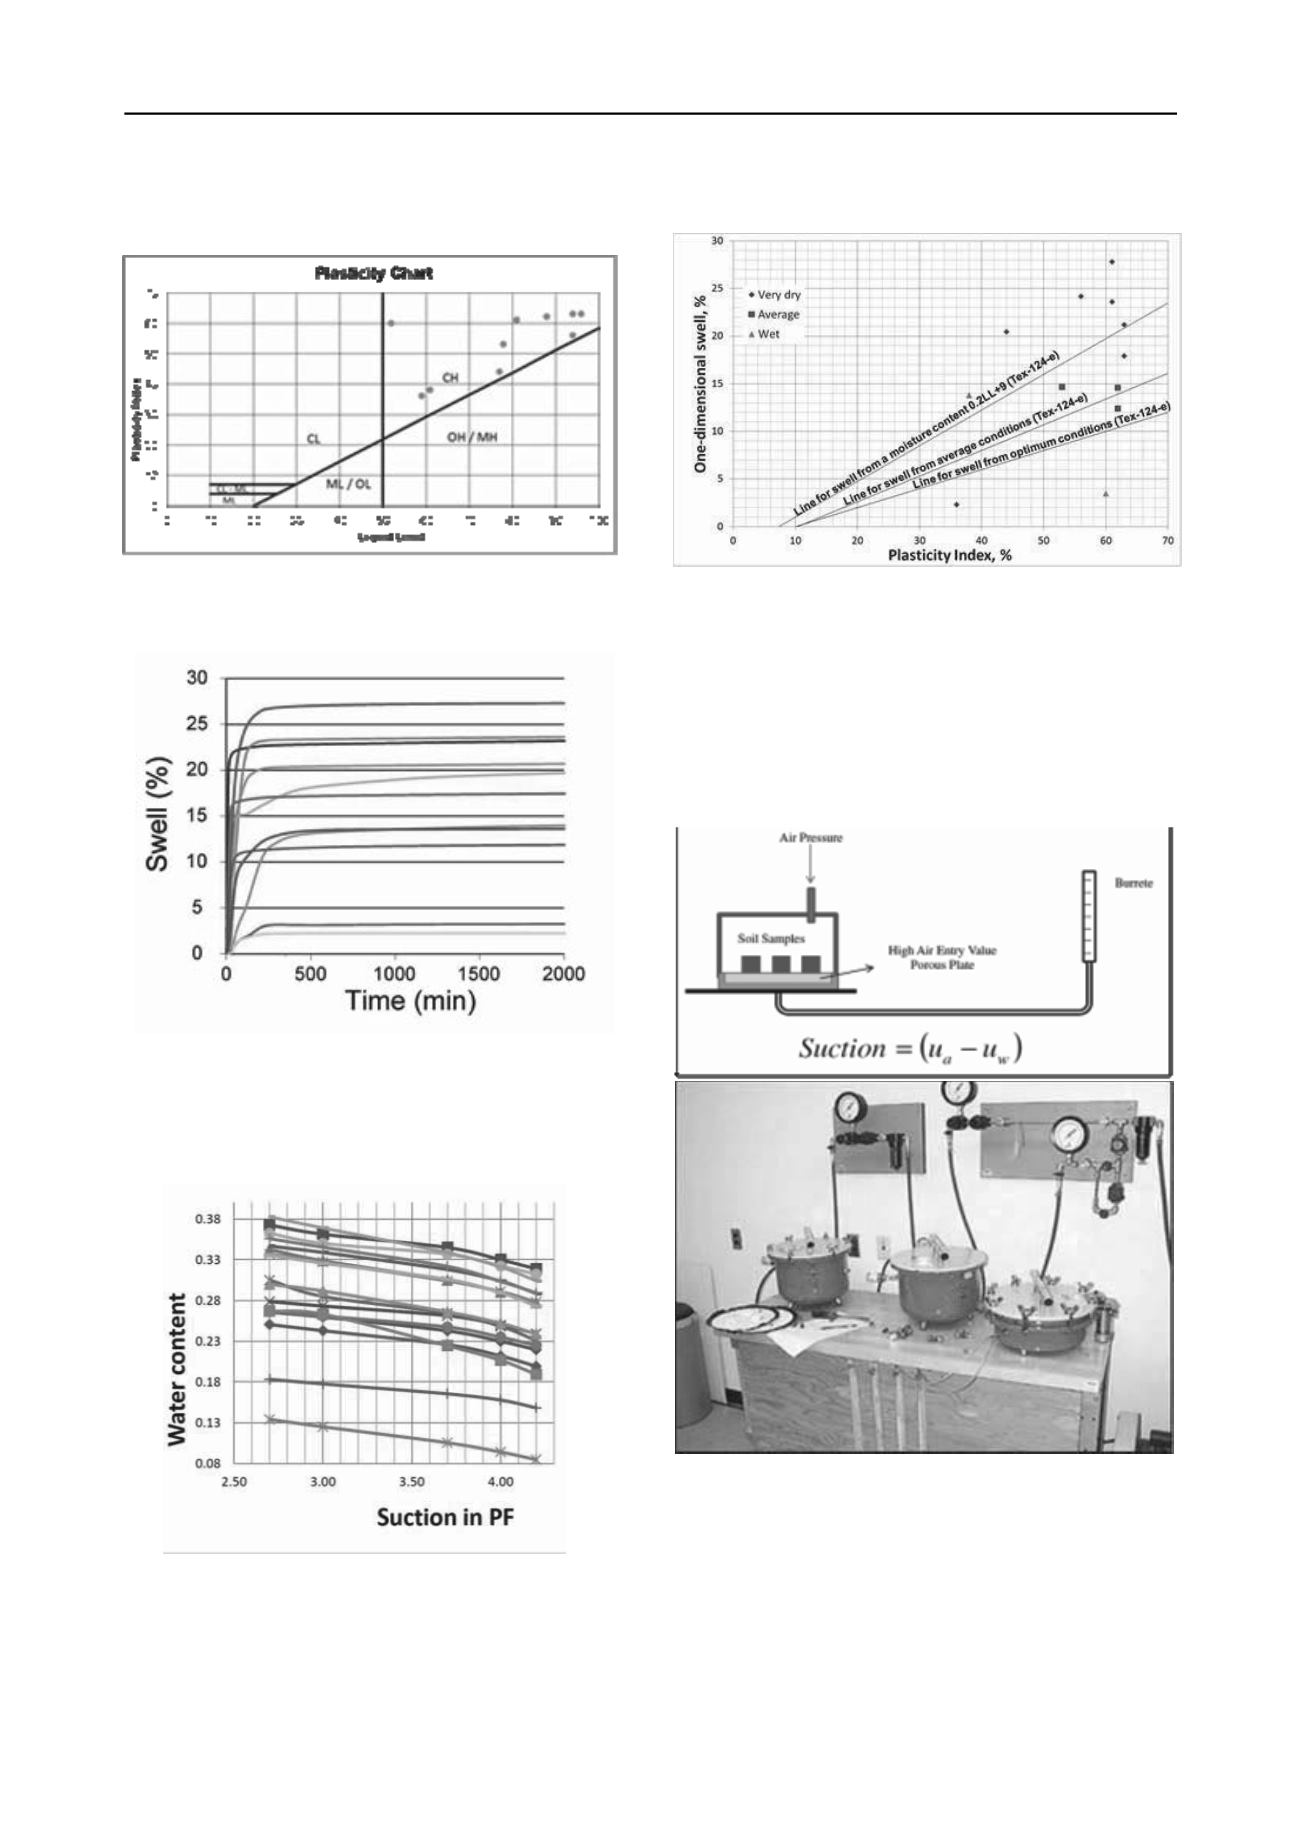
The Atterberg limits have been plotted in the plasticity chart
of Figure 4.
Figure 4. Plasticity chart. SH-130 samples.
Swell deformations were obtained from the oedometer tests.
The results are shown in the following Figure 5.
Figure 5. One-dimensional, free swell results.
The suction water characteristic curves from the pressure
plate suction tests are represented in Figure 6 below.
Figure 6. Pressure plate suction vs. water content characteristic
curves
The swell deformation values obtained from the oedometers
tests have been plotted in the graph of Tex-124-E for
comparison purposes. Figure 7 shows that the samples with a
moisture content in the very dry side have greater swell
deformations than predicted by Tex-124-E standard.
ensional swell
.2 Suction based
determine the SWCC of soils sampled in the south Austin area.
ational Research Council
rel
e of the samples.
The SWCC and the γ
h
can then be plotted.
Figure 7. Graph Plasticity Index vs. one dim
5
method for swell evaluation
There are several approaches to determine the suction
compression index (γ
h
). The soil water characteristic curve
(SWCC) and volume measurements determined in the
laboratory, can be used to calculate the γ
h
.The Texas A&M
University carried out pressure plate tests (see Figure 8) to
Figure 8. Pressure plat
Canada website).
e apparatus (from N
In the test, the weight and volume of the soil samples are
recorded at the end of each pressure cycle.The volume is
measured using the Ottawa sand displacement method. The
mass of the sand displaced is measured to calculate the
increments in volume of the samples.
Three PVC samples blocks with smooth surface are used to
calibrate the volume measurement equipment and obtain a
ation between the change in mass and volum


