1243
Technical Committee 202 /
Comité technique 202
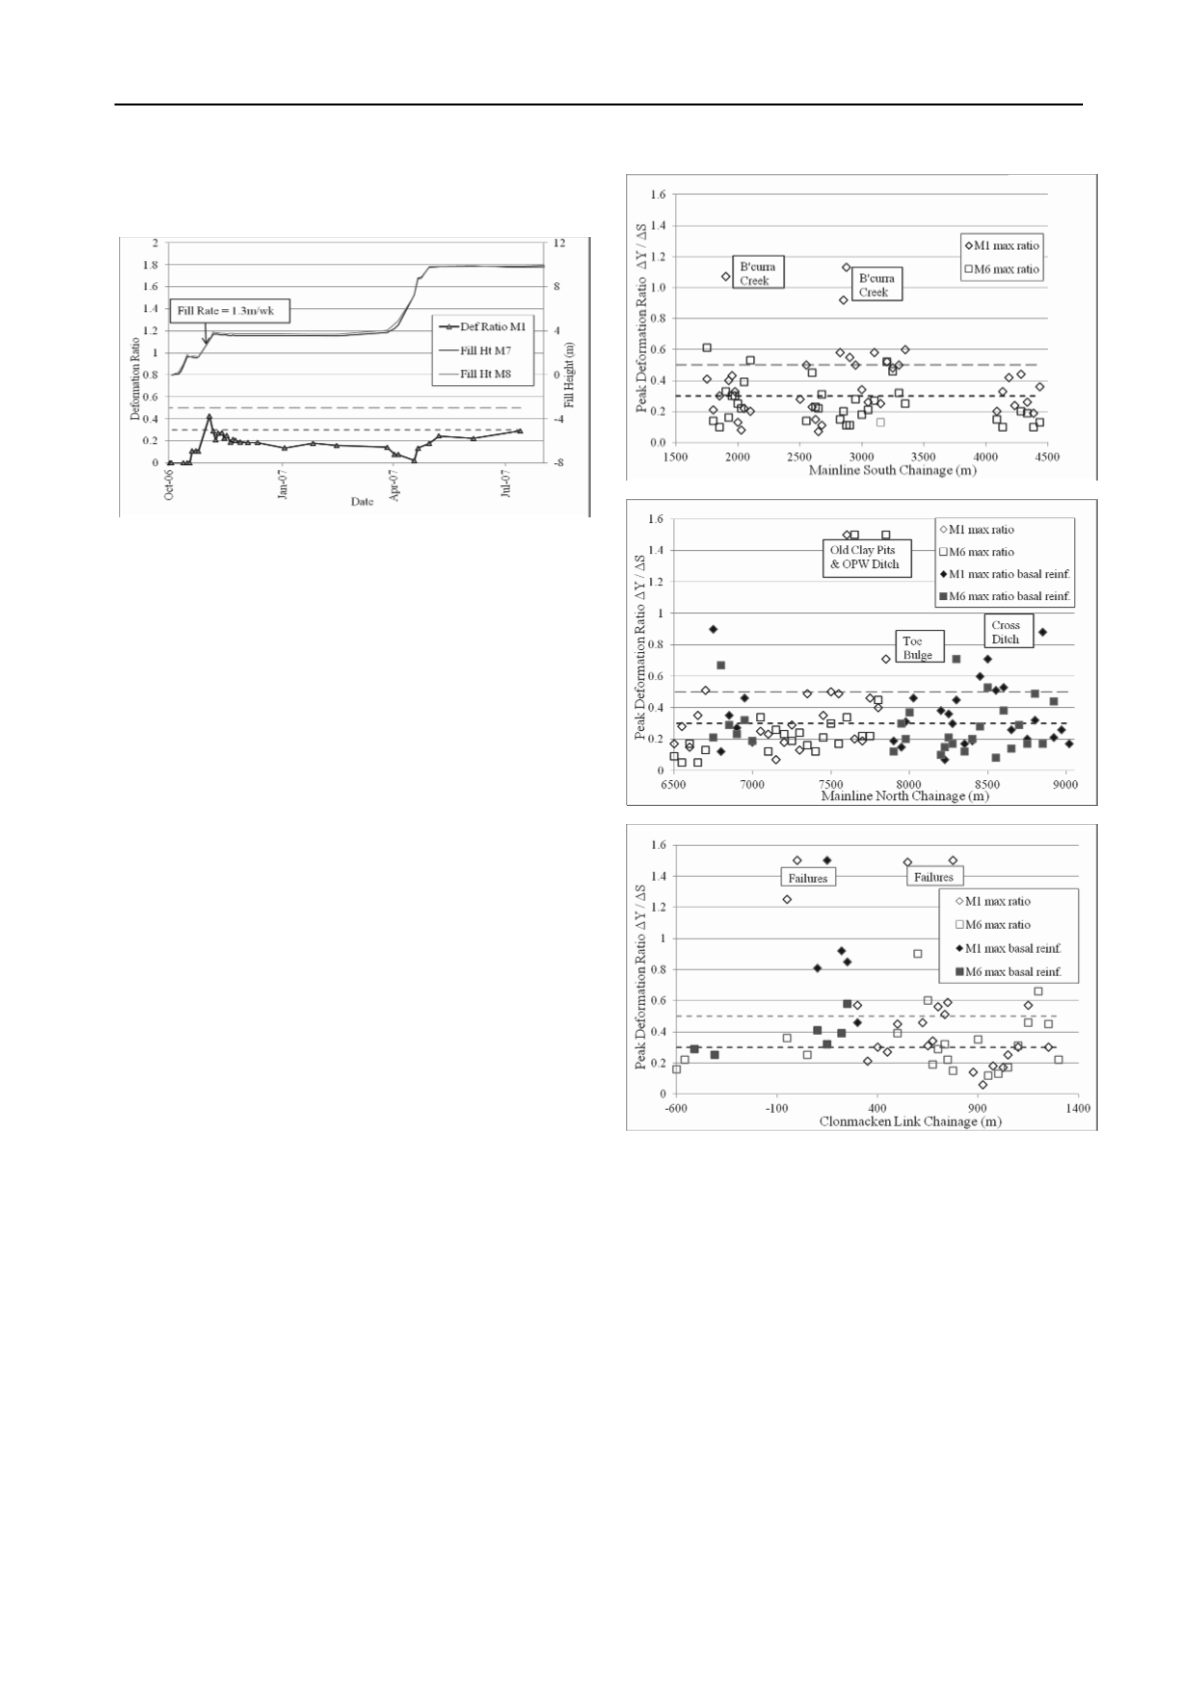
remaining near or below 0.3. This behaviour was commonly
observed elsewhere along the project..
Figure 2 Ch 4+185m Deformation Ratio & Fill Height v Time
The distribution of measured peak deformation ratio
throughout areas of the project improved by PVD and surcharge
is shown in Figures 3 (a), (b) & (c) for the mainline
embankment south and north of the River Shannon plus
Clonmacken Link respectively.
In general peak deformation ratios south of the Shannon
were kept below 0.6. Exceptions occurred at Ch 1+900 &
2+850 m where the embankment was constructed adjacent to
and within the original course of Ballinacurra Creek and
temporary sheet piling had to be employed to maintain stability.
Within the mainline north of the Shannon peak deformation
ratios were typically below 0.5. Exceptional values in excess of
1.0 occurred near Ch 7+550 m & 7+650 where local failure of
an existing back drain behind the Shannon flood protection
bund and instability in an area where the surface crust had been
historically removed for brick manufacture. In both cases local
instability occurred at relatively low embankment heights and
was mitigated by culverting the drain and incorporation of
geogrid reinforcement over short sections of the outer
embankment slope. Other high ratios occurred near the
locations of cross ditches.
Along Clonmacken Link several values in excess of 1
occurred associated with failures which are described in more
detail below. Interestingly the occurrence of high deformation
ratios is not particularly correlated to maximum embankment
height nor to the inclusion of basal geosynthetic reinforcement
within the embankment. Around 90% of all survey monitored
sections demonstrated a deformation ratio of under 0.6.
4.2
Embankment Failures at Clonmacken Link
During the period from June to September 2007 two significant
failures occurred over 50m lengths of embankment (from Ch
140 to 190 and from Ch 780 to 830m ) as filling extended their
height to around 3 - 3.5m. Both failures occurred on the left
(northern) side of the embankment and displaced a relatively
shallow block of alluvium up to 2.5m deep at the toe outwards
and closing a ditch constructed from 5 to 15m distant from the
toe. In both cases the failure plane was restricted to the
outermost section of embankment and did not pass through the
basal reinforcement or the drainage blanket which appeared to
function normally based on the nearest piezometer records.
Forensic investigations of both failures revealed the
following factors which had contributed to the instability:
Accidental over steepening of side slopes to around 1:1.3 in
lieu of the design slope of 1:2 (V:H);
Presence of nearby ditches, especially drains cut skew or
transverse to the embankment;
Figures 3 (a), (b) & (c). Peak Deformation Ratio v Chainage,
Mainline South, North & Clonmacken Link respectively.
Poor quality fill (Moisture Condition Value 5 to 8 with
significant organics) compounded by wet weather
conditions (Ch 140 – 190 m only); and
High filling rates around 1.5 to 3 m/week.
Typical deformation ratio history for instrumented location
at Ch 0+150 m is shown on Figure 4. The large incremental
settlements > 0.1m observed in early to mid September 2007
plus deformation ratio approaching 1.0 immediately prior to
failure in mid September both validate the selection of design
threshold values and were both reliable indicators of future
instability. Regrettably the data was not passed quickly enough
to engineers who could have acted to avert the failure by
preventing further filling after 17 September 2007. The final
filling rate of around 3m / week (1.3 metres in 3 days) could
never be sustained at this site and resulted in failure.


