1239
Technical Committee 202 /
Comité technique 202
where:
vmax
= vertical stress at full load
vmin
= vertical stress on unloading (slightly > 0)
hmax
= horizontal stress at full load
hmax
= horizontal stress on unloading
v
=
vmax
–
vmin
h
=
hmax
–
hmin
μ
= coefficient of friction (0.5 assumed)
h
= specimen height (approximately 150mm)
r
= specimen radius (75mm)
With these corrected stresses, the stiffness modulus and
Poisson’s ratio can be calculated with greater accuracy. Figure 3
shows a typical set of results from a PUMA test on a gravel
aggregate. On the figure, these are compared with a set of
predictions based on equations for the resilient non-linear stress-
strain behaviour of a gravel aggregate contained in Thom
(1988), providing a degree of added confidence that the
measurements and their interpretation are approximately
correct.
0
50
100
150
200
250
300
0
1000
2000
3000
4000
Modulus (MPa) / v x 100
Number of load applications
Siffness modulus ‐ test
Stiffness modulus ‐ prediction
Poisson's ratio (v) ‐ test
Poisson's ratio (v) ‐ prediction
Figure 3. Stiffness modulus and Poisson’s ratio – corrected for friction
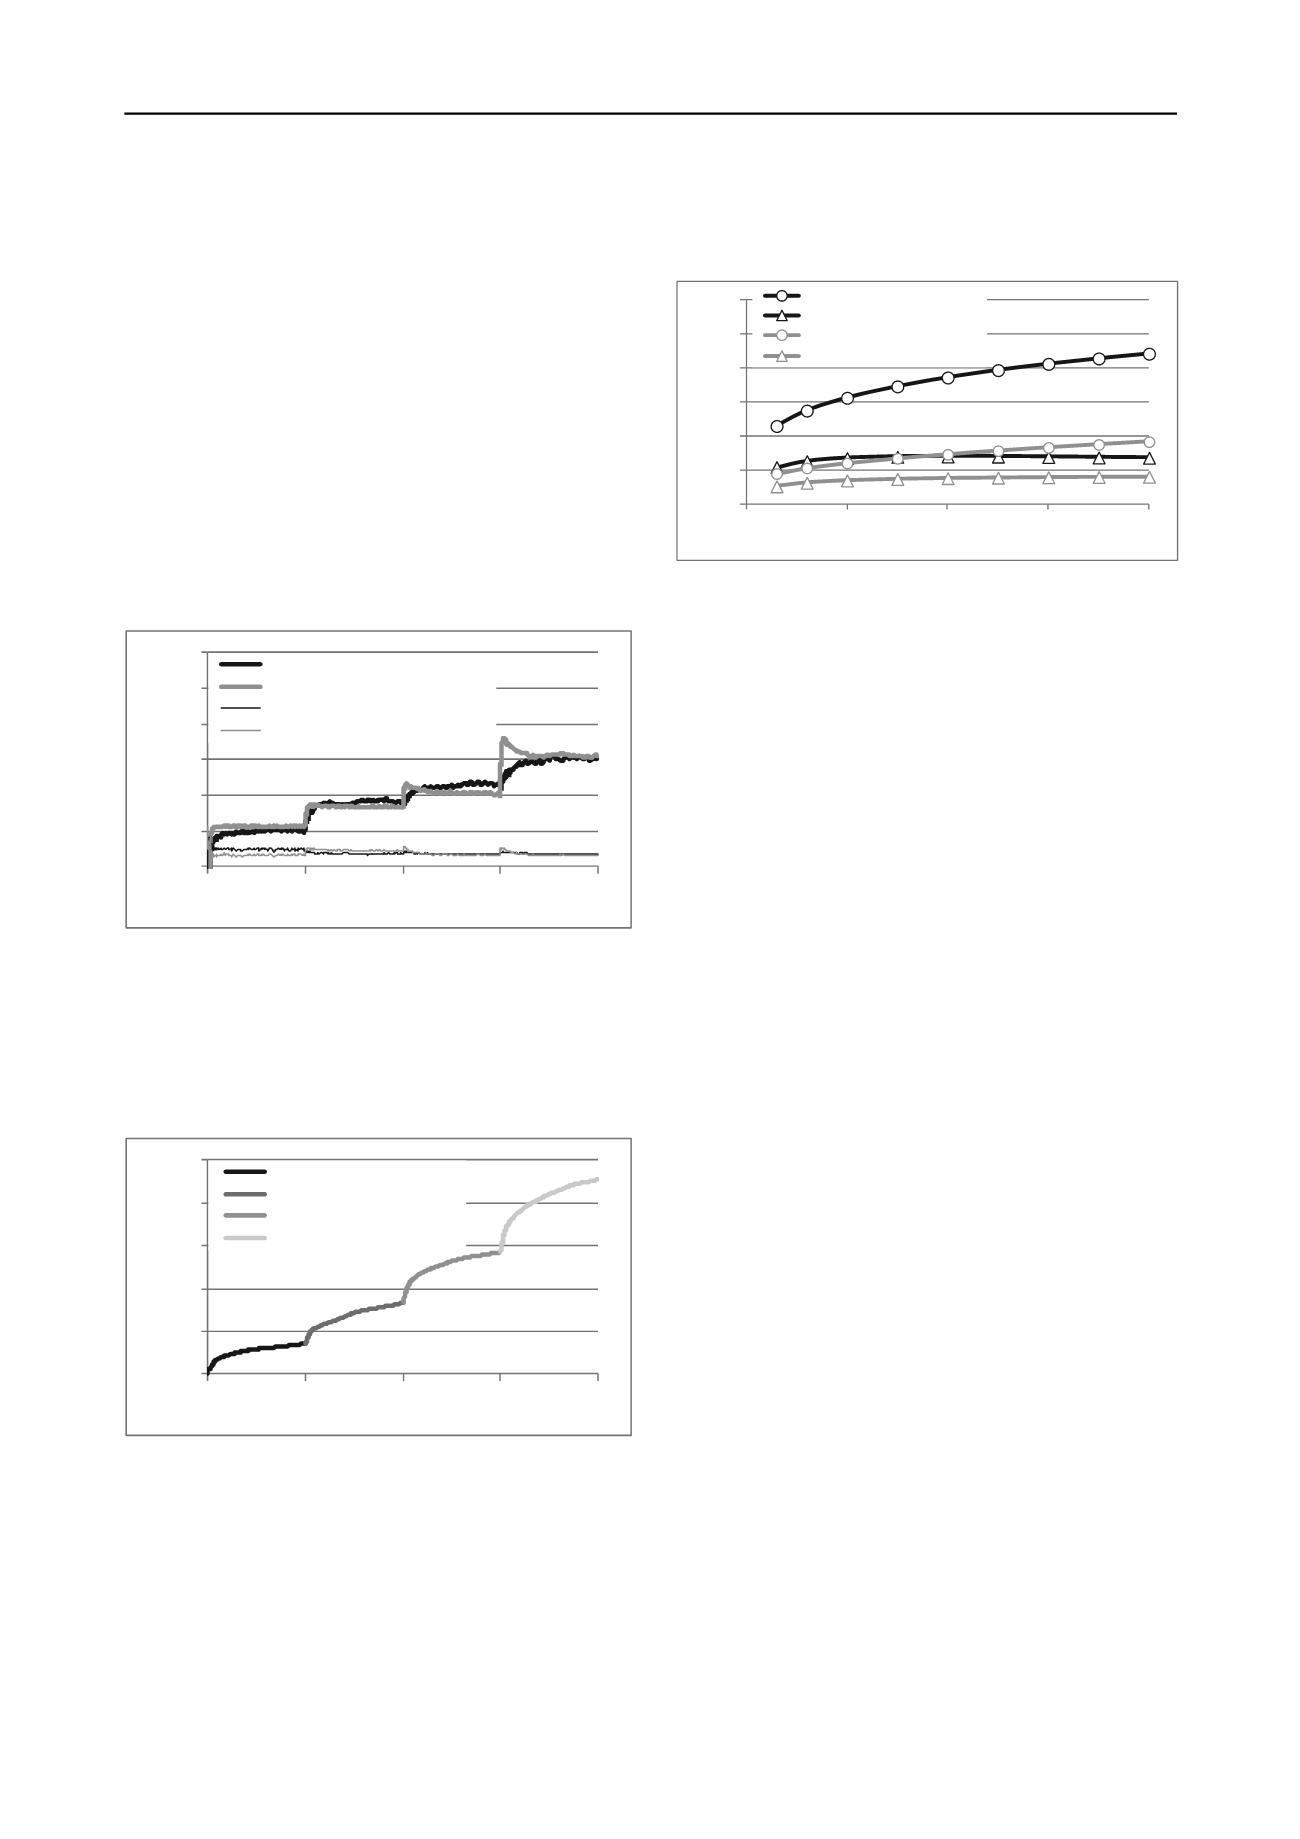
Figure 4 shows some typical results for the accumulation of
permanent strain under the four stages of repeated loading. Use
of data of this type is not presently catered for in the Highways
Agency’s design method but it can be useful at the material
selection stage for use on a comparative basis.
0
0.5
1
1.5
2
2.5
0
1000
2000
3000
4000
Vertical strain (%)
Number of load applications
Vertical stress: 5‐23kPa
Vertical stress: 5‐43kPa
Vertical stress: 5‐85kPa
Vertical stress: 7‐175kPa
Figure 4. Accumulation of permanent strain in a typical PUMA test
4 USE OF DATA
4.1
Selection of Appropriate Stress Level
A key requirement for a realistic stiffness modulus test is that
the stress conditions should be representative of those in the
pavement. For a completed pavement, an estimate of such
conditions can be derived from multi-layer linear elastic
analysis and this was carried out for two cases, one with 140mm
of asphalt (Case 1) and the other with 240mm (Case 2),
assuming a temperature of around 20
C. At mid-depth in a
200mm base layer below the asphalt, the computed stresses due
to a 100kN axle (50kN wheel) load were found to be as shown
in Figure 5.
0
50
100
150
200
250
300
0
500
1000
1500
2000
Compressive stress (kPa)
Base StiffnessModulus (MPa)
Case 1: vertical stress
Case 1: horizontal stress
Case 2: vertical stress
Case 2: horizontal stress
Figure 5. Predicted traffic induced stresses at mid-depth in the base
layer
Although the stresses in Figure 5 only represent a limited
range of examples, they suggest the sort of stress levels that
should be applied to achieve a realistic stiffness modulus for
pavement design. For example, using the data in Figures 2 and 5
and taking the case of a 300MPa base layer, the stress
conditions would be similar to Stage 3 of the test routine in the
case of a 140mm asphalt pavement and Stage 4 with 240mm of
asphalt.
It is also necessary to consider the case of insitu testing using
an LWD, which typically applies a vertical stress of about
100kPa, and for which it is difficult to predict the appropriate
horizontal stress due to the non-linear nature of granular
materials. Nevertheless, adopting an earth pressure coefficient
approach the situation is akin to an active rather than passive
state, in which case the ratio of vertical to horizontal stress is
likely to be of the order of 4 to 5. This gives a likely horizontal
stress of 20kPa to 25kPa near to the surface under an LWD
load. Since it is known that the horizontal stress state has a
controlling influence on measured stiffness modulus, similar to
the effect of confining stress in a triaxial test, it is logical to
ensure that this is correctly simulated. This suggests that either
Stage 1 or 2 of the proposed test routine is likely to give a
stiffness modulus suitable for inclusion in a foundation surface
modulus prediction. Stage 1 is likely to be most appropriate for
the uppermost layer, while Stage 2 may represent conditions in
an underlying foundation layer.
4.2
Design example
By way of example, the data shown in Figure 3 have been used
to generate a design for a UK Highways Agency Class 2
foundation (Highways Agency, 2009) which requires an
equivalent surface modulus of 100MPa under a 240mm thick
asphalt layer. The designation ‘Class 2’ represents the condition
in the finished pavement and it is, therefore, appropriate to use
Stage 4 of the PUMA test, which gives a material stiffness
modulus of 150MPa.
It is also necessary to evaluate the stiffness modulus of the
subgrade soil. This can also be carried out in the PUMA, again
taking Stage 4 conditions for the completed pavement and it is
assumed here that this gave a stiffness modulus of 60MPa.
It is now possible to use multi-layer linear elastic analysis to
determine the equivalent foundation modulus under the
completed pavement. It is suggested here that the most
appropriate design methodology is to compare computed
asphalt tensile strains (the asphalt fatigue cracking design
criterion) under a given load, first with the intended 2-layer
foundation, then with a single layer only, representing the
equivalent foundation with a single stiffness value. On this
basis, 260mm of the gravel material in Figure 3 is required.


