692
Proceedings of the 18
th
International Conference on Soil Mechanics and Geotechnical Engineering, Paris 2013
the dynamic pile foundation behaviors due to mechanical and
seismic loads since 1960s. The seismic responses of the pile
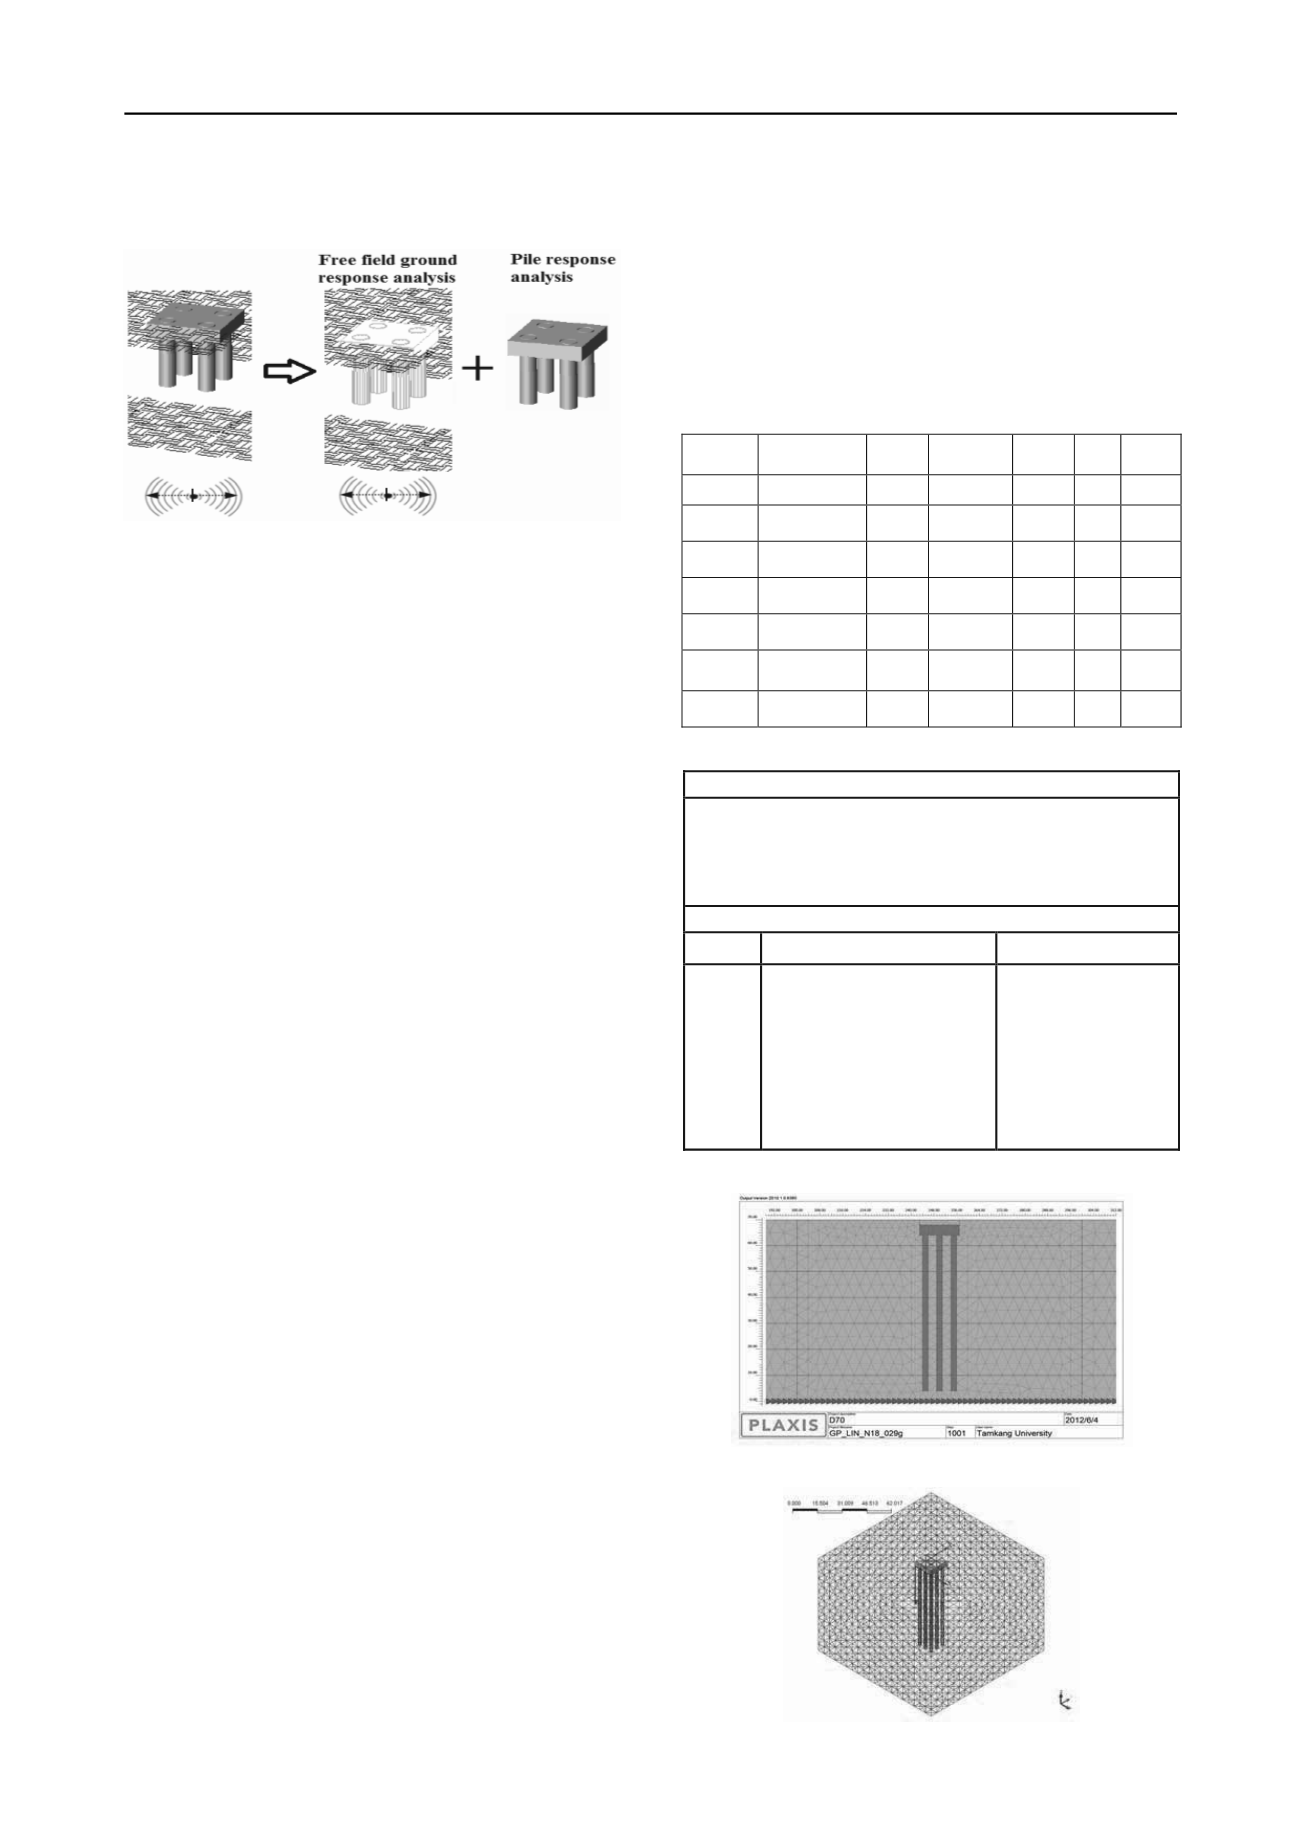
Figure 1. Schematic layout of EQWEAP analysis
foundation can be modeled closely by three-dimensional FE
analysis. The geometric conditions of the site and the structure
can be captured in details by a 3D FE modeling. The concerns
of the loadings interfered with the shape of the structure are
sometimes very important to the analysis. For example, if a
torque is applied to the pile foundation where the pile cap has
irregular shape and/or the piles are not in symmetric
orientation, the 3D FE analysis will provide the most
appropriate solution for sure. For simplicity of applications, 2D
FE analysis has been frequently conducted for pile foundations.
In both analyses, one needs to be cautioned about the sizes of
the mesh and the elements in use. The type of element
sometimes is also important, especially for nonlinear problems
and time-domain analysis using explicit integration scheme.
The solutions need to be checked to ensure their stability. In
this study, the 2D PLAXIS program and 3D MIDAS GTS
program are respectively used to simulate the pile responses.
Both programs are well known civil engineering software and
have been used in many studies and projects. Detailed
introduction of these programs can be found in Wang (2012).
One shortcoming of using these programs is that the pile
nonlinearities are unable to model properly through the use of
beam elements or the isoparametric plane/solid elements in the
packages. Nonlinearities of the concrete structure need to be
enhanced in these programs.
4 COMPARATIVE STUDIES ON NUMERICAL MODELS
A bridge pile foundation of an expressway in Hsinchuang
District in New Taipei City, Taiwan was studied by EQWEAP,
PLAXIS and MIDAS GTS analyses. Table 1
depicts the
geological conditions and the properties and parameters of the
soils at the site. Table 2
presents the soil models and model
parameters used in each analysis. Acceleration time histories of
1999 Chi-Chi earthquake (M=7.3 and local intensity of IV) at a
near-by seismic station
TAP017
were used to simulate the
seismic responses of the model piles. Studies were made for
following tasks, 1. Linear analysis for piles located in elastic
homogeneous layers. 2. Nonlinear analysis for piles in inelastic
homogeneous layers. 3. Nonlinear analysis for piles in inelastic
interlayer. 4. Effects of the seismic intensity. 5. Effects of the
seismic excitations from other directions. Due the linearity of
the pile elements used in PLAXIS and MIDAS GTS programs,
the numerical studies were made assuming that the pile remain
in linear elasticity. For homogeneous layer system, an averaged
shear velocity of the soils was computed using the equivalent
travel-time method. The original shear wave velocity of the
soil can be obtained by empirical formulations with SPT-N
values. Figure 2 and Figure 4
show the numerical models used
for PLAXIS and the verifications of the solutions by varying
the width of the analytical mesh. Figure 3 and Figure 5 show
the numerical models used for MIDAS and the verifications of
the solutions by varying the width of the analytical mesh.
Figure 6
depicts the maximum pile displacements occurred
along the piles at the five tasks and Figures 7~11 present the
pile displacement time histories recorded at different locations.
It can be seen that the maximum pile displacements and the
displacement time histories from these analyses are very
similar with each other. Table 3 indicates the computation time
used in each analysis and their ratios via the computer in use.
Table 1 Geotechnical information of numerical model in this study
Depth
(m)
Layers
Soil
γ
(kN/m
3
)
SPT-
N
()
Vs
(m/s)
0~4
SF
Sand
18
3
30
115
4~10
Sungshan
formation VI
CM
19
5
28
171
10~20
Sungshan
formation V
SM
20
14
33
192
20~40
Sungshan
formation IV
CM
20
11
28
222
40~50
Sungshan
formation III
SM
20
21
34
221
50~60
Sungshan
formation II
CM
20
14
35
241
60~70
Sungshan
formation I
SM
20
30
30
248
Table 2 Material parameters and structural dimensions in use
Parameters and dimensions of piles
Bridge pile foundation 3×3 piles
Pile diameter: 2m, Pile length: 60m
Design vertical loads: Ordinary 9000 kN, Seismic 18000 kN,
Horizontal load = 10~15% vertical load
、
Maximum steel bar Ar = 2%
E=30 MN/m
2
、
= 0.1
5、
=24 kN/m
3
Model parameters used for soils
Approach
Method/model parameter
Spring and damper
EPWP
Finn’s EPWP model
where C
1
=0.8, C
2
=0.79,
C
3
=0.45, C
4
=0.73; R =
0.00031(100-Dr)
2
+
0.0062; m=0.43, n = 0.62,
k
2
= 0.0028; Seed and
Idriss’s model of G/G
max
where K
2,max
=
f
(Dr);
and Skempton’s equation
where Dr (%) =
f
(N
1,60
)
Spring:
K
s
=
n
h
x ;
empirical relationships
of SPT-N and
n
h
could
be found in Johnson
and Kavanagh (1968)
Damper: Transformed
damping (Chang and
Yeh, 1999)
NOTE:
V
s
=80N^1/3 for sand,
V
s
=100N^1/3 for clayey soils
.
Figure 2. Discrete mesh used in 2D PLAXIS analysis
Figure 3. Discrete mesh used for 3D MIDAS GTS analysis


