685
Technical Committee 103 /
Comité technique 103
Table 1. Physical Properties
Parameter
(kg/m
3
)
E
(Pa)
Φ
(°)
ν
c’
(Pa)
Bedrock
2200
5
1.93e10
5
30
5
0.38
5
3.0e5
5
Clay
1631 2.00e6
0
0.4
6
1.5e4
Loose Silt
1835 1.24e7
27
0.3
0
Embankment Fill
2039 3.03e7
6
34
0.4
6
0
Stone
1983
2
3.03e7
6
36
2
0.4
6
0
Deep Mixed Soil
1631
1
1.25e9
32
0.2
6
3.4e5
Sawdust
1040
3
8.50e5
32
3
0.05
3
0
Geofoam
15
4
3.76e6
32
0.09
7
1.1e5
4
1
Oliveira et al, 2011,
2
Abusharar and Han, 2011,
3
Rowe and
Soderman, 1984,
4
Geotech Systems Corporation, 1993,
5
Itasca, 2009,
6
Kulhawy and Mayne, 1990,
7
Hazarika, 2006
5 NUMERICAL MODELING RESULTS
To evaluate the efficiency of each method of ground
improvement a baseline model was run which simulated the
construction of a 6 m embankment without neither ground
improvements nor light weight fill. All results have been
normalized against the vertical displacements and vertical
stresses calculated using the baseline model.
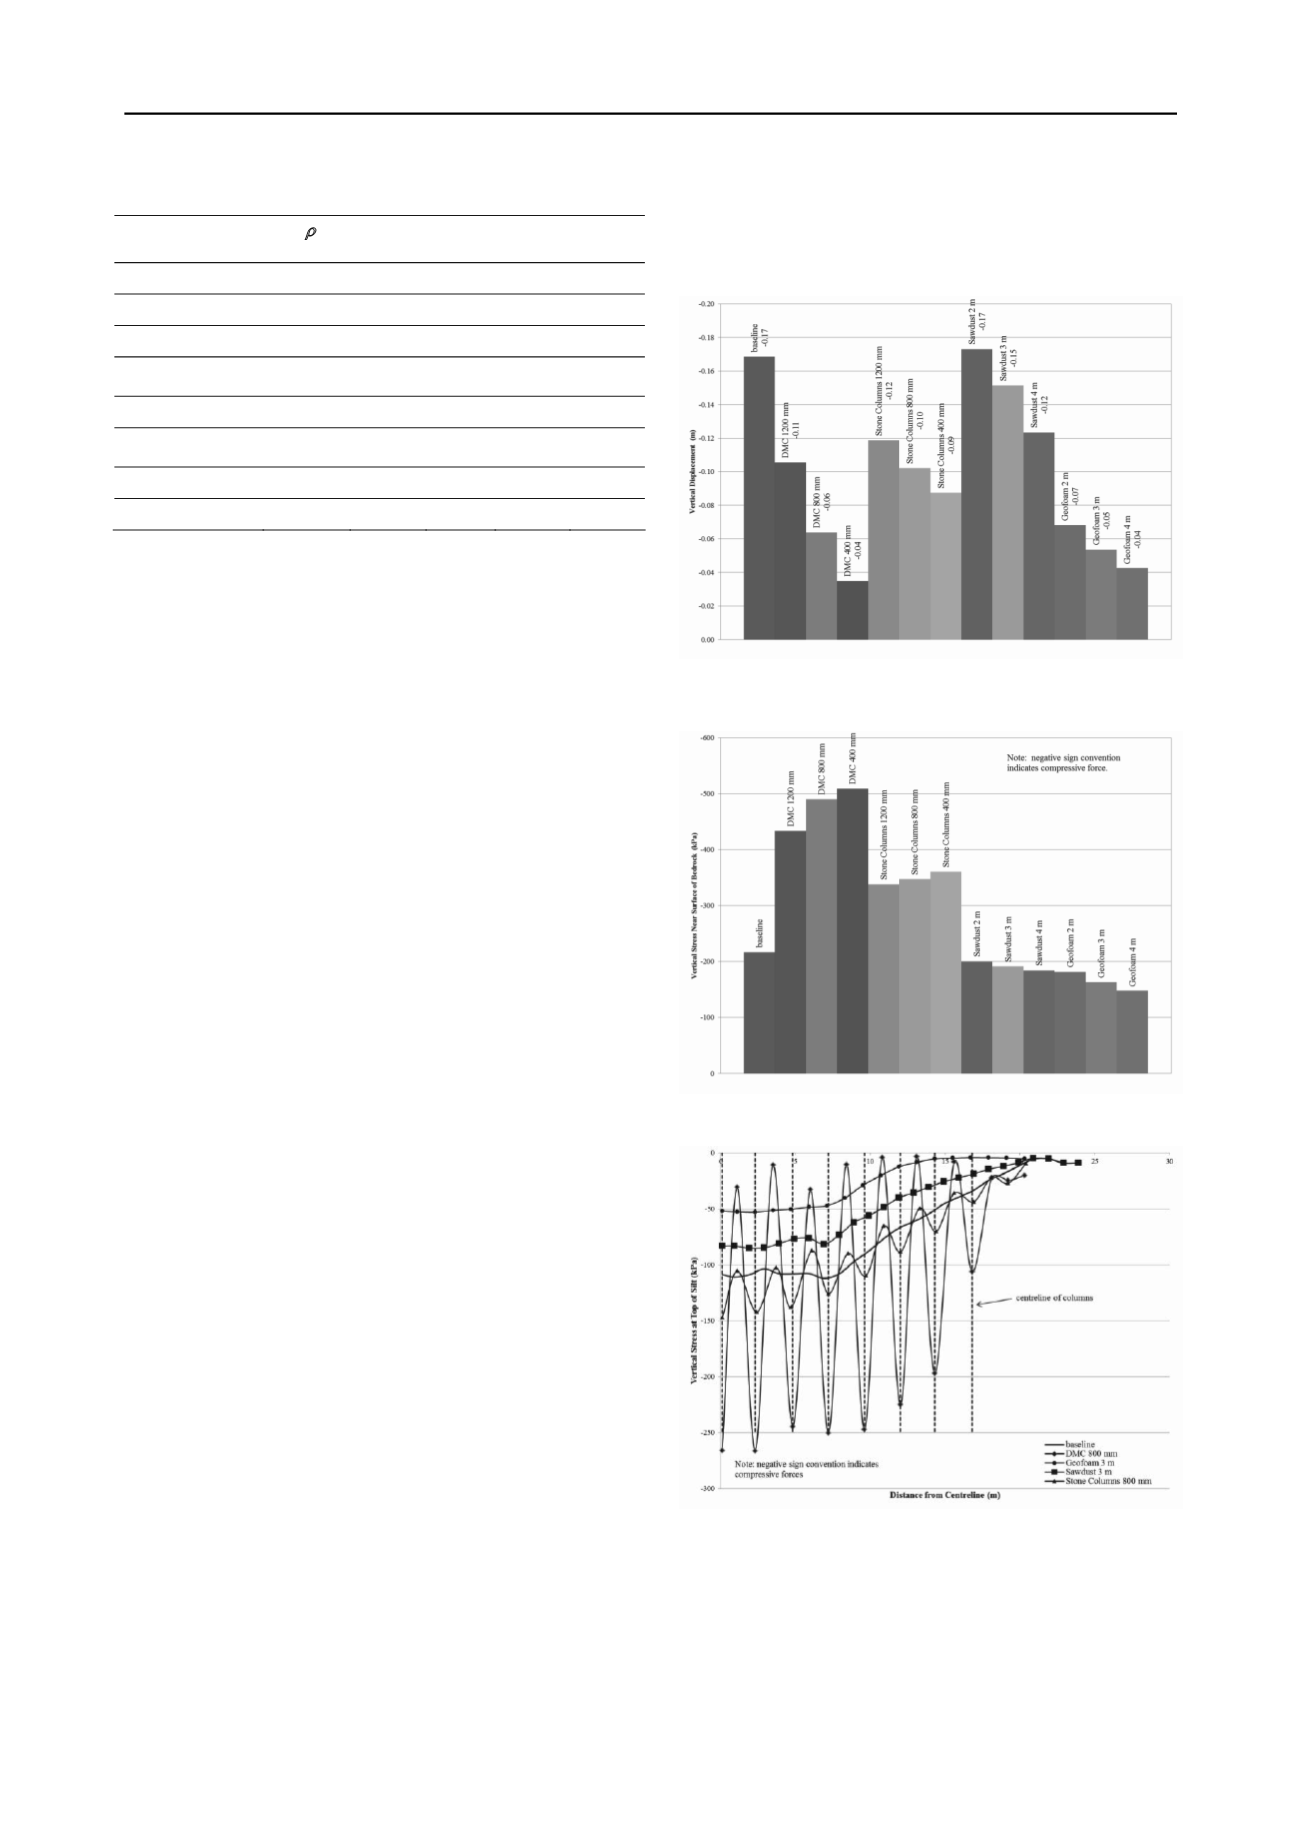
5.1 Settlement
Settlements calculated at the top of the silt layer at the
centerline of the embankment were used for comparisons.
Figure 2 illustrates magnitudes of settlement calculated for each
method. The baseline model predicted a total settlement of
0.170 m. The model with 2 m of sawdust showed negligible
improvement while the models with 4 m of geofoam, and
400 mm deep mixed columns, were the most effective with
predicted settlements of 0.040 m, or a 76% reduction. It can be
seen from Figure 2 that in general the geofoam and the deep
mixed coulmns performed better than the sawdust and the stone
columns with respect to the reduction of settlement.
5.2 Vertical stress
Figure 3 shows the maximum vertical stresses calculated near
the surface of bedrock for the different considered ground
improvement methods in comparison to the baseline model. For
illustration purposes only one example for each method is
provided. The following paragraphs include results for all of the
analyses carried out.
The baseline model predicted a vertical stress of 217 kPa
near the surface of bedrock. The model with 4 m of geofoam, as
expected, experienced the greatest reduction in predicted
vertical stresses at 32% of the baseline value, or 68 kPa. The
difference in vertical stress was based on comparison of the
vertical stresses between the respective models and the baseline
calculated at the same point. The stone and deep mixed
columns, as result of the stiffness contrast between the column
material and surrounding soils, are attracting additional loads
due to soil arching. The ability of the stone columns to
accumulate stress from soil arching is limited because the
columns are yielding themselves; however, the trend is still
visible as shown in Figure 4. Figure 5 illustrates how soil
arching reduces the vertical stresses as the column’s diameter
increases to a point at which is becomes less effective. The
percentage difference in vertical stress is based on a comparison
of the vertical stresses calculated at the centerline of the column
and the midspan between columns for each model near the
ground surface. It is noted that the behavior for both types of
columns is very similar and that the overall strength
characteristics will determine the magnitude of the percentage
reduction in stresses. The decrease in soil arching effectiveness
is attributed to the increased spacing between columns. In this
analysis a constant replacement ratio was maintained, therefore,
as the column diameter increased the spacing was increased as
well.
Figure 2. Comparison of predicted settlements at the interface between
the embankment and the ground surface based on different methods of
ground improvements
Figure 3. Comparison of predicted vertical stresses near the surface of
bedrock based on different methods of ground improvements
Figure 4. Comparison of predicted vertical stresses calculated at the top
of the silt layer based on variable methods of ground improvements


