2635
Technical Committee 211 /
Comité technique 211
3.3
Effect of fiber length
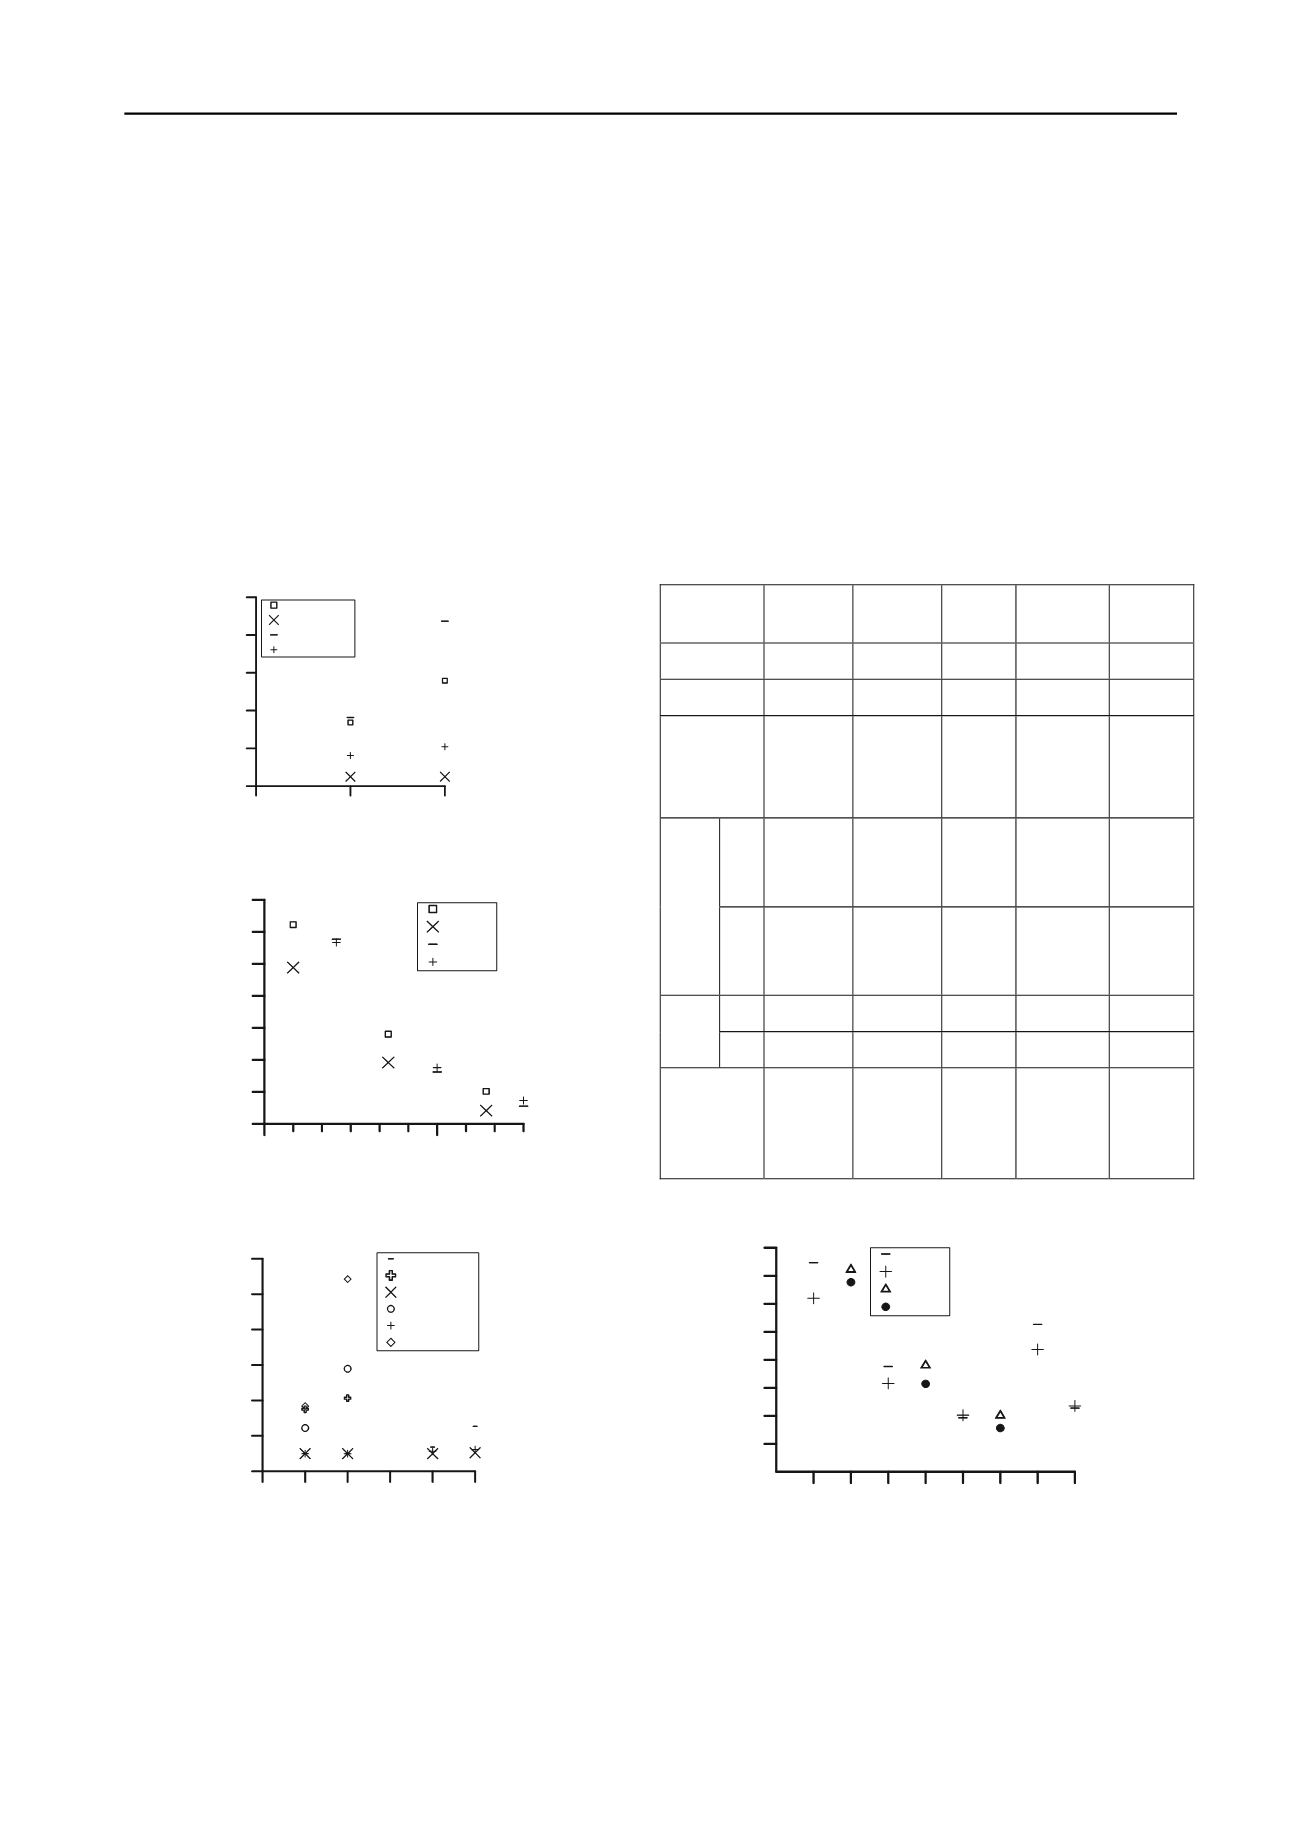
For 12mm fiber reinforcement, 0.08% and 0.16% fiber content
was used. It was found that 0.16% fiber reinforcement is much
better than 0.08% fiber reinforcement (see Figure 4). Hence,
only results of 0.16% fiber content were compared. Figure 5
presents the effect of fiber length on the strength and ductility of
the FRCT soil. It can be seen from Figure 5a that for PVA-
reinforced specimens, 12mm fiber confers distinctly higher
strength than 6-mm fibers. For PP fibers, the difference in peak
strength is small.
Figure 5b shows that for specimens with different mix ratio
and a given type of fiber (PVA), longer fibers consistently give
a lower BI than shorter fibers; the difference increasing with
strain level. Similar trend is also observed in specimens
reinforced by PP fibers. Therefore, the effect of fiber length on
ductility of FRCT soil is significant for both PP and PVA fiber
type.
Figure 4. Ductility of RFCT soil with 0.08% and 0.16% 12mm long
fiber (50% cement and 100% water content).
(a) Comparison in peak strength for specimens with 50% cement
content, 100%-167% water content, and 0.16% of 12mm or 6 mm long
fiber (HL, HM, HH denote cement and water content, see Table 2).
(b) Brittleness versus strain for specimens with different mix ratio and
0.16% of 12mm or 6mm long fiber.
Figure 5. Effect of fiber length on strength and ductility for RFCT soil
specimens.
3.4
Effect of fiber type
For simplicity and convenience, FRCT soil specimens are
categorized in Table 2 according to their cement content and
water content together with their performance at optimum fiber
content. As discussed in the previous section, the optimum short
fiber content is 0.32% for mix ratio 2:1:3 while it is 0.24% for
mix ratio 2:1:4, 2:1:5, 20:7:27 and 5:1:6. For long fiber, the
optimum fiber content is 0.16%.
Figures 6-7 present the effect of fiber type on the strength
and BI of the FRCA soil. It can be seen from Table 2 and Figure
6 that 12mm PVA fiber reinforcement always gives higher
strength than 12mm PP fiber reinforcement due to PVA’s
higher strength. For water content at and below 133% and
cement content not less than 35%, 6mm PVA fiber
reinforcement gives higher strength than 6mm PP fiber
reinforcement due to the same reason above. For low cement
content (20%) and low water content (100%) or high cement
(50%) and high water content (167%), short PP fiber gives
slightly higher strength than short PVA fiber.
Table 2. Peak strength and BI of specimens with different mix ratios
nd fiber types, at optimum fiber content.
a
Mix
proportion
2:1:3
2:1:4
2:1:5
20:7:27
5:1:6
A
w
(%)
50
50
50
35
20
C
w
(%)
100
133
167
100
100
catogery
high A
w
,
low C
w
(HL)
high A
w
,
mid C
w
(HM)
high
A
w
&
C
w
(HH)
mid A
w
,
low C
w
(ML)
low A
w
&C
w
(LL)
SF 1494
(PVA)
,
1240
(PP)
752
(PVA),
632
(PP)
386
(PVA),
405
(PP)
1053
(PVA),
874
(PP)
455
(PVA),
471
(PP)
Peak
stren
-gth
q
u
(kPa
)
LF 1445
(PVA),
1354
(PP)
761
(PVA),
628
(PP)
403
(PVA),
313
(PP)
NA
NA
SF
PVA>PP
PVA=PP
PVA=PP
PVA=PP
PVA<PP
Duc-
tility
LF
PVA>PP
PVA=PP
PVA>PP
NA
NA
Perfor-
mance
PVA>PP
PVA>PP
PVA
PP
(short)
PVA>PP
(long)
PVA>PP
PVA<PP
0
5
Axial strain (%)
10
0.95
1.15
1.35
1.55
1.75
1.95
Brittleness index
0.08%PVA12
0.16%PVA12
0.08%PP12
0.16%PP12
Specimen type
200
400
600
800
1000
1200
1400
1600
Peak strength (kPa)
PVA12
PVA6
PP12
PP6
HL
HM HL
HM HH HH
Note: SF and LF denotes short and long fiber respectively
Figure 6. Effect of fiber type on strength of RFCT soil specimens with
20%-50% cement content, 100%-167% water content, 0.24-0.32% of
6mm long fiber or 0.16% of 12mm long fiber.
For 12mm fiber reinforcement, Figure 7a shows that for
specimens with high cement content (50%) and low or high
water content (100% or 167%), PVA fiber gives lower BI
values at four different strain levels between 5%-25% than PP
fiber. For specimens with high cement content and mid high
water content (133%), no fiber type effect is observed. This may
Specimen type
200
400
600
800
1000
1200
1400
1600
Pea
PVA6
0 5 10 15 20 25
Axial strain (%)
0.9
1.1
1.3
1.5
1.7
1.9
2.1
Brittleness index
2:1:3-PVA12
2:1:3-PVA6
2:1:4-PVA12
2:1:4-PVA6
2:1:5-PVA12
2:1:5-PVA6
HL
LL
HM HH HM
HL
HH ML
k strength (kPa)
PP6
PVA12
PP12


