2634
Proceedings of the 18
th
International Conference on Soil Mechanics and Geotechnical Engineering, Paris 2013
The natural marine clay was first mixed with the prescribed
amount of water to achieve 100% moisture content and
remoulded. Cement slurry with the water-cement ratio needed
to achieve the desired mix ratio was then added to marine clay
in a Hobart Mixer and mixed at a rotational speed of 125rpm for
around 5 minutes. The fiber was finally added to cement soil
mixing and mixed for another 10 minutes. For mixtures with
water content of 100%, the superplasticizer was used to improve
their workability. The dosage of the superplasticizer was 1.13-
2.27l/100kg soil+cement solids. The mixture was placed into a
50mm (diameter) by 100mm (height) cylindrical polyvinyl
chloride (PVC) split-mould. No compaction was applied during
placement. Specimens were then submerged in distilled water
within their split-moulds without loading for curing. The
specimens were then taken out after 7 days for unconfined
compression testing. The test procedure followed those
prescribed in ISO/TS 17892 (2004). The strain rate used for the
unconfined compression test was 1.32%/min.
3 EXPREIMENT RESULTS AND ANALYSIS
3.1
Stress strain behavior
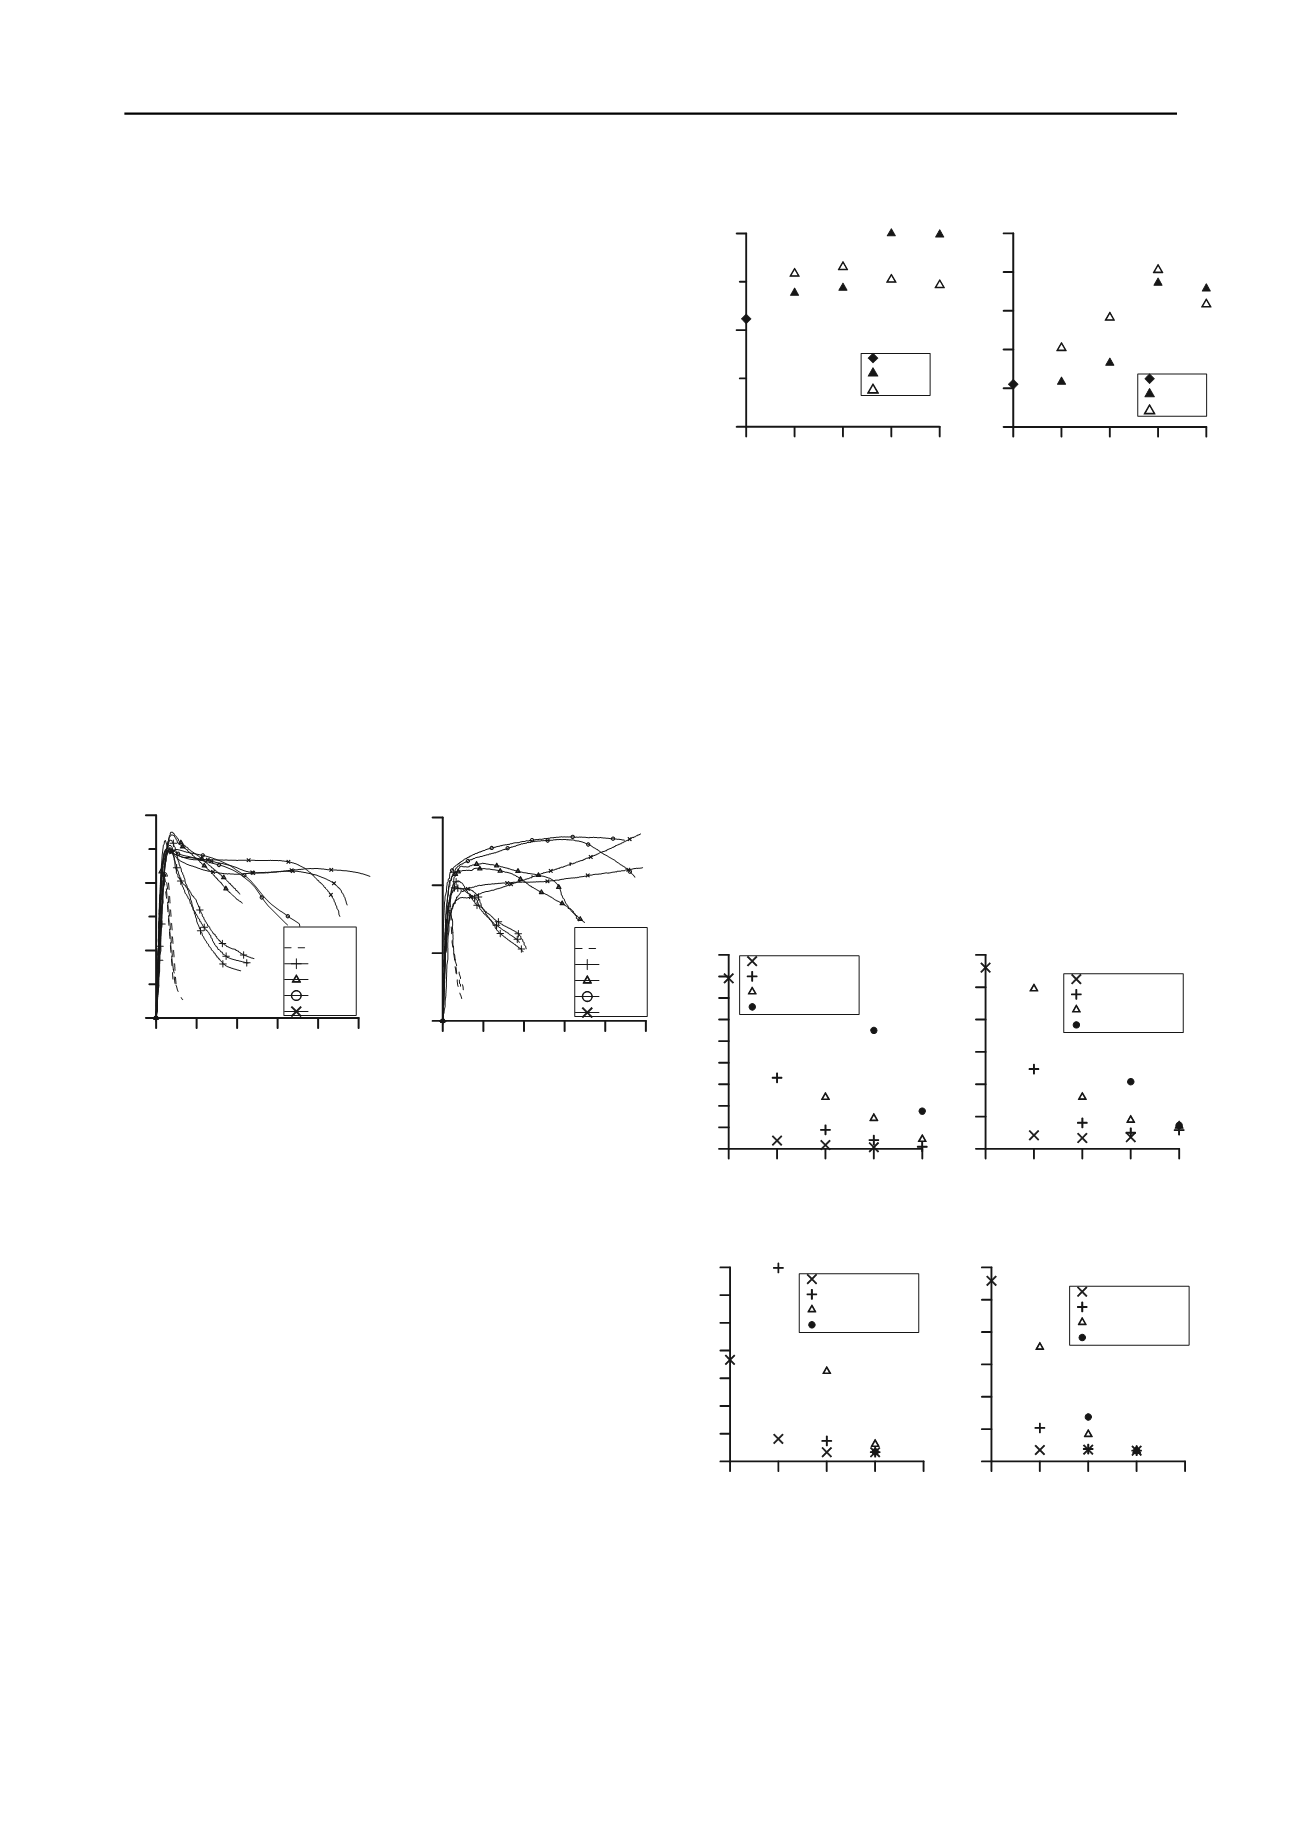
Figure 1 shows the typical stress strain behavior of FRCT soil
specimens under unconfined compression. Compared to purely
cement-treated soil, fiber reinforcement increases the strength
and ductility significantly, the ductility increasing with fiber
content.
(a) (b)
Figure 1. Stress strain behavior for FRCT soil specimens with 6mm
long fiber. (a) 50% cement content and 100% water content; (b) 50%
cement content and 167% water content.
3.2
Effect of fiber content
Figures 2-3 present the effect of fiber content on peak strength
and brittle index of FRCT soil specimens. As Figure 2a shows,
for both PP and PVA reinforced specimens with mix ratio 2:1:3
(cement content 50%, water content 100%), the peak strength
increases with fiber content until a certain fiber content (0.16-
0.24%), after which it decreases slightly. A similar trend is also
observed in Figure 2b for specimens with mix ratio 2:1:5
(cement content 50%, water content 167%).
0 0.08 0.16 0.24 0.32
fiber content (%)
500
1000
1500
peak strength
q u
(kPa)
no fiber
PVA
PP
0 0.08 0.16 0.24 0.32
fiber content (%)
200
250
300
350
400
450
peak strength
q u
(kPa)
no fiber
PVA
PP
(a) (b)
Figure 2. Effect of fiber content on strength for FRCT soil specimens.
(a) Specimens with mix ratio 2:1:3 (cement content 50%, water content
100%); (b) Specimens with mix ratio 2:1:5 (cement content 50%, water
content 167%).
Figures 3a-3b show that the BI, evaluated at four different
axial strain levels between 2% and 20%, reduces significantly
with both PP and PVA fiber content for specimens with mix
ratio 2:1:3. A similar trend is also observed from Figures 3c-3d
for specimens with mix ratio 2:1:5. At higher fiber content, that
is, higher than 0.32% for mix ratio 2:1:3 and 0.24% for mix
ratio 2:1:5, the results were very scattered due to the poor
workability of the mix, which can be observed in Figure 1b.
Hence, with current mixing condition, the optimum fiber
content, taking into account performance and workability, is
0.32% and 0.24% for specimens with mix ratio 2:1:3 and 2:1:5
respectively. For mix ratios 2:1:4, 20:7:27 and 5:1:6, the
optimum fiber content is 0.24%.
0 0.05 0.1 0.15 0.2 0.25
axial strain (%)
0
500
1000
1500
q u
(kPa)
fiber content
no fiber
0.08%
0.16%
0.24%
0.32%
0 0.05 0.1 0.15 0.2 0.25
axial strain (%)
0
150
300
450
q u
(kPa)
fiber content
no fiber
0.08%
0.16%
0.24%
0.32%
0 0.08 0.16 0.24 0.32
PVA fiber content (%)
1
1.2
1.4
1.6
1.8
2
2.2
2.4
2.6
2.8
Brittleness index
2% of axial strain
5% of axial strain
10% of axial strain
20% of axial strain
0 0.08 0.16 0.24 0.32
PP fiber content (%)
0.9
1.2
1.5
1.8
2.1
2.4
2.7
Brittleness index
2% of axial strain
5% of axial strain
10% of axial strain
15% of axial strain
(a) (b)
0 0.08 0.16 0.24 0.32
PVA fiber content (%)
0.9
1.2
1.5
1.8
2.1
2.4
2.7
3
Brittleness index
2% of axial strain
4% of axial strain
8% of axial strain
15% of axial strain
0 0.08 0.16 0.24 0.32
PP fiber content (%)
0.9
1.2
1.5
1.8
2.1
2.4
2.7
Brittleness index
2% of axial strain
5% of axial strain
10% of axial strain
15% of axial strain
(c) (d)
Figure 3. Effect of fiber content on ductility for FRCT soil specimens.
(a) PVA reinforced specimens with mix ratio 2:1:3 (cement content
50%, water content 100%); (b) PP reinforced specimens with mix ratio
2:1:3 (cement content 50%, water content 100%); (c) PVA reinforced
specimens with mix ratio 2:1:5 (cement content 50%, water content
167%); (d) PP reinforced specimens with mix ratio 2:1:5 (cement
content 50%, water content 167%).


