2467
Technical Committee 211 /
Comité technique 211
If the characteristic value f
c,k
is smaller than 4 MPa,
additional creep tests have to be conducted with a load of f
c,k
/2
as described in the annex B of the DIN 4093.
The design strength for calculations with the concept of
partial safety factors is then computed as follows:
m
k,c
d,c
f
85.0 f
(3)
where 0.85 is a factor to consider permanent situations and γ
m
is
the material safety factor as defined in Eurocode 7 (1.5 for
permanent and temporary load cases and 1.3 for accidents). For
temporary situations, the design strength is computed without
the 0.85 coefficient.
As reported in Topolnicki and Pandrea (2012), if
independent and separate design calculations are performed for
compressive and shear stresses (i.e. no 3D stress analysis), the
maximum allowed compressive stress is 0.7 x f
c,d
and the
maximum allowed shear stress is 0.2 x f
c,d
.
For comparison with the previous version of the DIN 4093
(published in September 1987), Table 1 presents cumulated
safety factors on material strength (f
m,mittel
) and equivalent
global safety factors (γ
m
x γ
G,Q
)/(α x 0.85 x (0.7 or 1)) computed
with the new DIN 4093 for permanent design situations. An
increase in the number of test samples has no effect on the
safety factors.
Table 1. Cumulated safety factors on material strength (f
m,mittel
) and
equivalent global safety factors in permanent design situation according
o DIN 4093 – August 2012 (γ
m
= 1.5).
t
For
=0.6
For
=0.75
With 3D analysis
Cumulated safety factor
2.94
2.35
Permanent actions (γ
G
=1.35)
Equivalent global safety factor
Variable actions (γ
Q
=1.50)
Equivalent global safety factor
3.97
4.41
3.18
3.53
Without 3D analysis
Cumulated safety factor
4.20
3.36
Permanent actions (γ
G
=1.35)
Equivalent global safety factor
Variable actions (γ
Q
=1.50)
Equivalent global safety factor
5.67
6.30
4.54
5.04
For comparison, in the previous version of the DIN 4093
(September 1987), the design value was computed as follows:
5
,
,
mittel
m
dc
f
f
(4)
for samples with UCS values expected larger than 5 MPa and
tested according to the DIN 1048 standard for concrete material,
or with the help of:
3
,
u
dc
q
f
(5)
for samples with UCS values expected smaller than 5 MPa and
tested according to the DIN 18 136 for soil material. q'
u
is the
UCS value computed according to the DIN 18136.
Considering the safety factor of 5 and the reduction factor of
0.7 related to the 3D character of the loading, the previous
version of the DIN 4093 resulted in a global safety factor of
7.14
.
For this second approach based on an average value with
safety factor, Denies et al. (2012) have remarked that first, the
definition of the most suitable mean (arithmetic mean, median,
etc.) should depend on the type of the distribution of the dataset.
Second, problems may arise with limited number of samples,
skewed populations and in the presence of subpopulations.
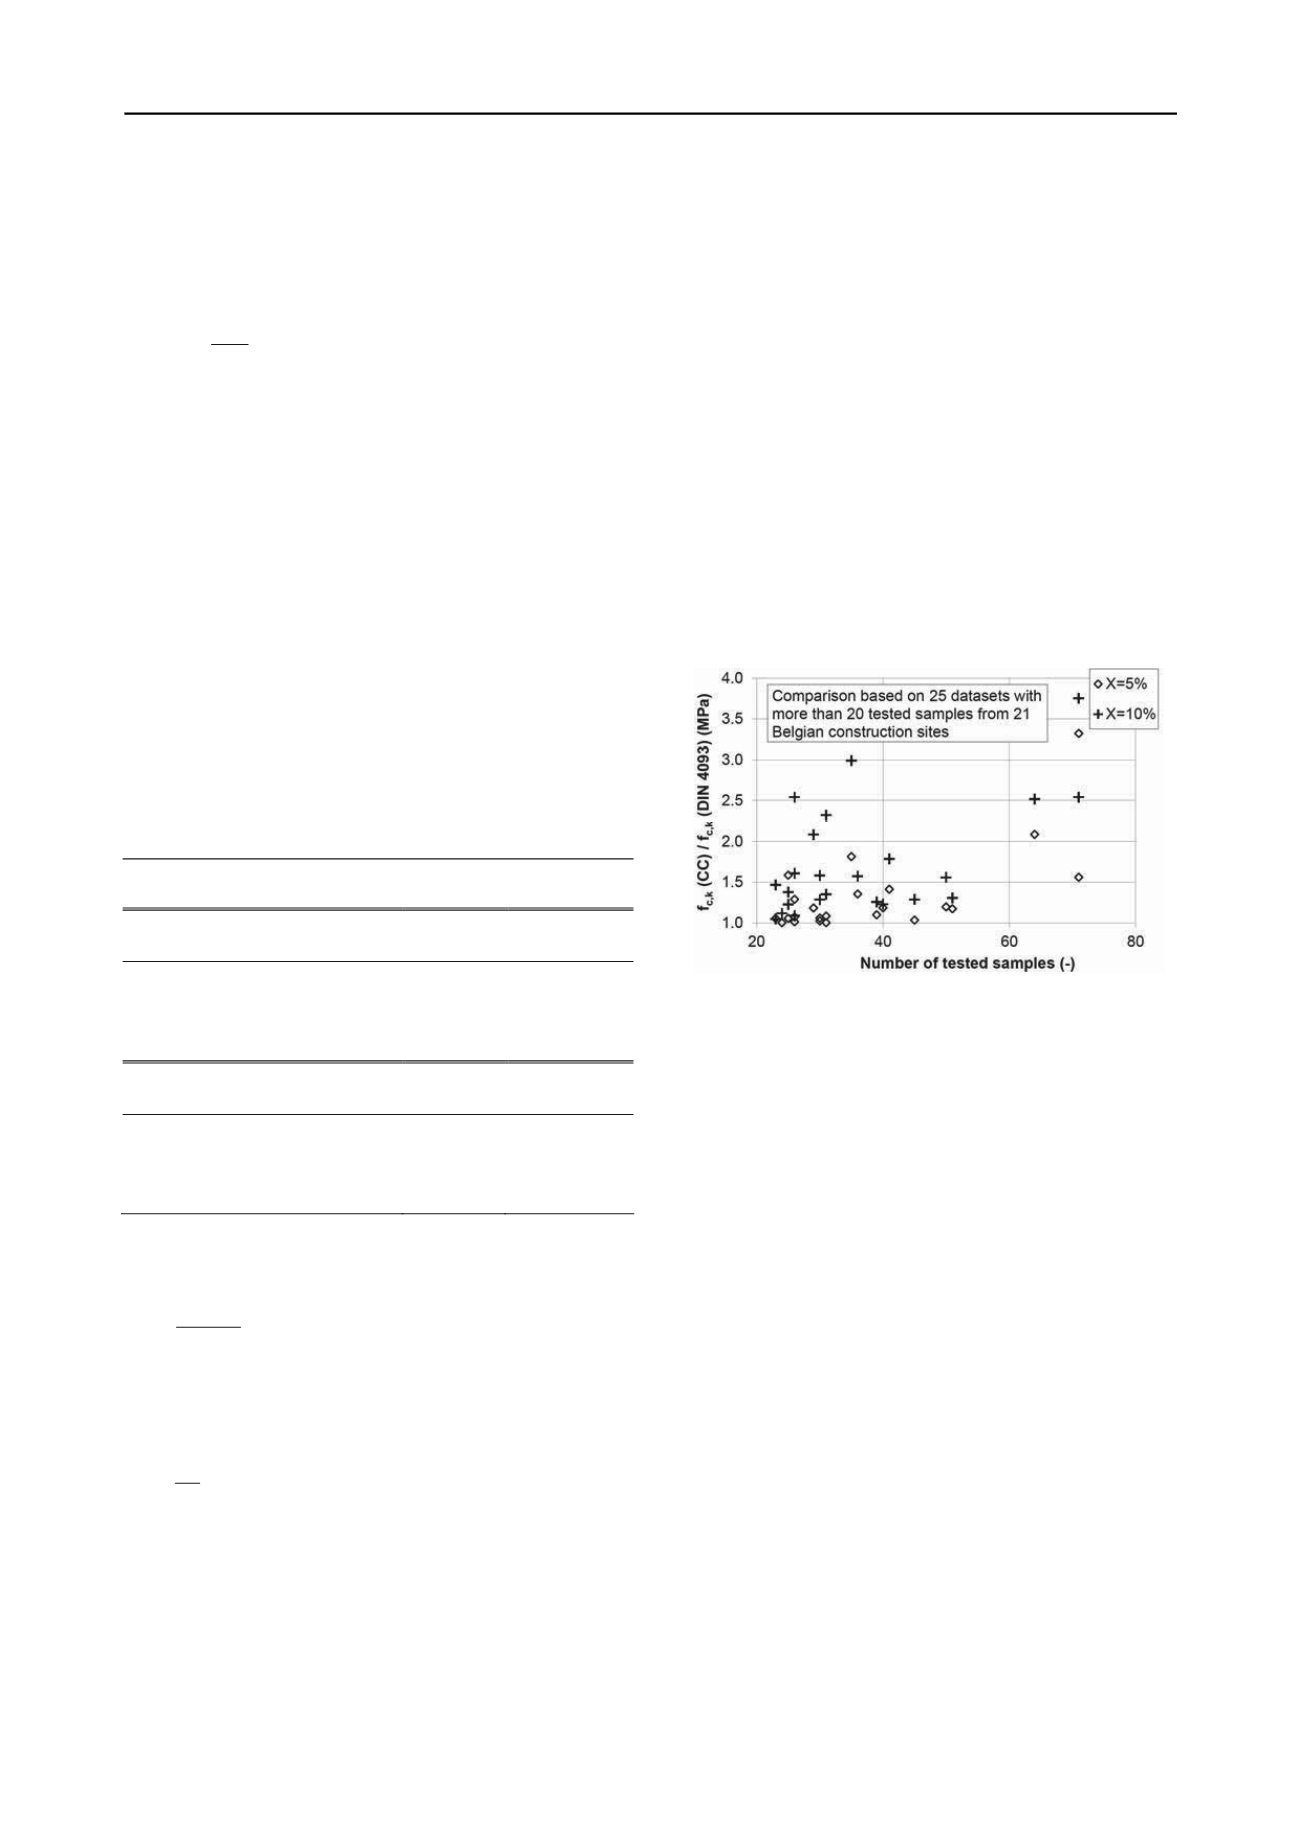
Figure 3 compares the UCS characteristic value computed
with the help of the cumulative frequency curve (CC method) or
with respect to the DIN approach. The ratio of the two
characteristic values is presented as a function of the number of
tested samples for each considered dataset. Minimum 20
samples are necessary in order to conduct the statistical analysis
on the cumulative frequency curve. As observed in Fig. 3, the
UCS characteristic value is always greater when computed with
the help of the cumulative frequency curve (all the values are
larger than 1). In Fig. 3, results are given for two different X%
lower quantiles: X = 5% and 10%. Indeed, for the first category
of approaches (based on the lower limit value), a value for the
X% has to be defined. A more detailed analysis is necessary to
determine if a 5% lower limit, as often stated in Eurocode 7, is a
representative characteristic value for the strength of the soil
mix material. Actually, one major issue is the representativeness
of the core samples with regard to the in situ executed DSM
material.
Figure 3. Ratio of the characteristic values (f
c,k
(CC) and f
c,k
(DIN4093))
as a function of the number of tested samples.
3 INFLUENCE OF THE UNMIXED SOIL INCLUSIONS
There is mainly the question of the influence of unmixed soft
soil inclusions on the mechanical behaviour of the DSM
material. Indeed, as a natural material (i.e. soil) is being mixed,
it is to be expected that the entire wall is not perfectly mixed
and homogeneous: inclusions of unmixed soft soil are present.
As a result, Ganne et al. (2010) have proposed to reject all test
samples with soil inclusions > 1/6 of the sample diameter, on
condition that no more than 15% of the test samples from one
particular site would be rejected. This possibility to reject test
samples results from the reflexion that a soil inclusion of 20 mm
or less does not influence the behaviour of a soil mix structure.
On the other hand, a soil inclusion of 20 mm in a test sample of
100 mm diameter significantly influences the test result. Of
course, this condition is only suitable if one assumes that there
is no soil inclusion larger than 1/6 of the width of the in situ
DSM structure. For the purpose of studying this question, 2D
numerical simulations were performed at KU Leuven with the
aim to quantify the effect of soil inclusions on the DSM strength
and stiffness. The following parameters are being considered:
size, number, relative position and percentage of soil inclusions.
The results of this study are presented in Vervoort et al. (2012)
and Van Lysebetten et al. (2013). As illustrated in Fig. 4, they
confirm that DSM samples with soft soil inclusions larger than
1/6 have a considerable influence on the deduction of the
engineering values. Based on this numerical analysis, the “rule
of 1/6” as proposed by Ganne et al. (2010) seems to be justified.


