2466
Proceedings of the 18
th
International Conference on Soil Mechanics and Geotechnical Engineering, Paris 2013
product, but guidance rules for the design of SMW are still
lacking in particular for the determination of a “characteristic
value” representative of the strength of the soil mix material.
Neither in the Eurocode 7 nor in the European standards for
grouting (EN 12715), jet-grouting (EN 12716) or deep-mixing
(EN 14679), specifications are given for the internal strength of
the material.
In practice, Quality Assurance (QA) and Quality Control
(QC) activities are commonly related to tests on core samples
for the determination of the Unconfined Compressive Strength
(UCS) and the modulus of elasticity (E) of the material. Both
values allowing an approach of the design taking into account
the bending characteristics (EI), the deformation (E), the
arching effect (UCS) and the structural resistance (UCS) of the
element. For engineering purposes and as part of the semi-
probabilistic design approach presented in Eurocode 7, it is thus
essential to define the UCS characteristic value that can be
taken into account in the design of DSM structures. The
following paragraphs discuss the definition of this value.
2 DETERMINATION OF THE UCS CHARACTERISTIC
VALUE OF DSM MATERIAL
2.1
On the basis of an X% lower limit value
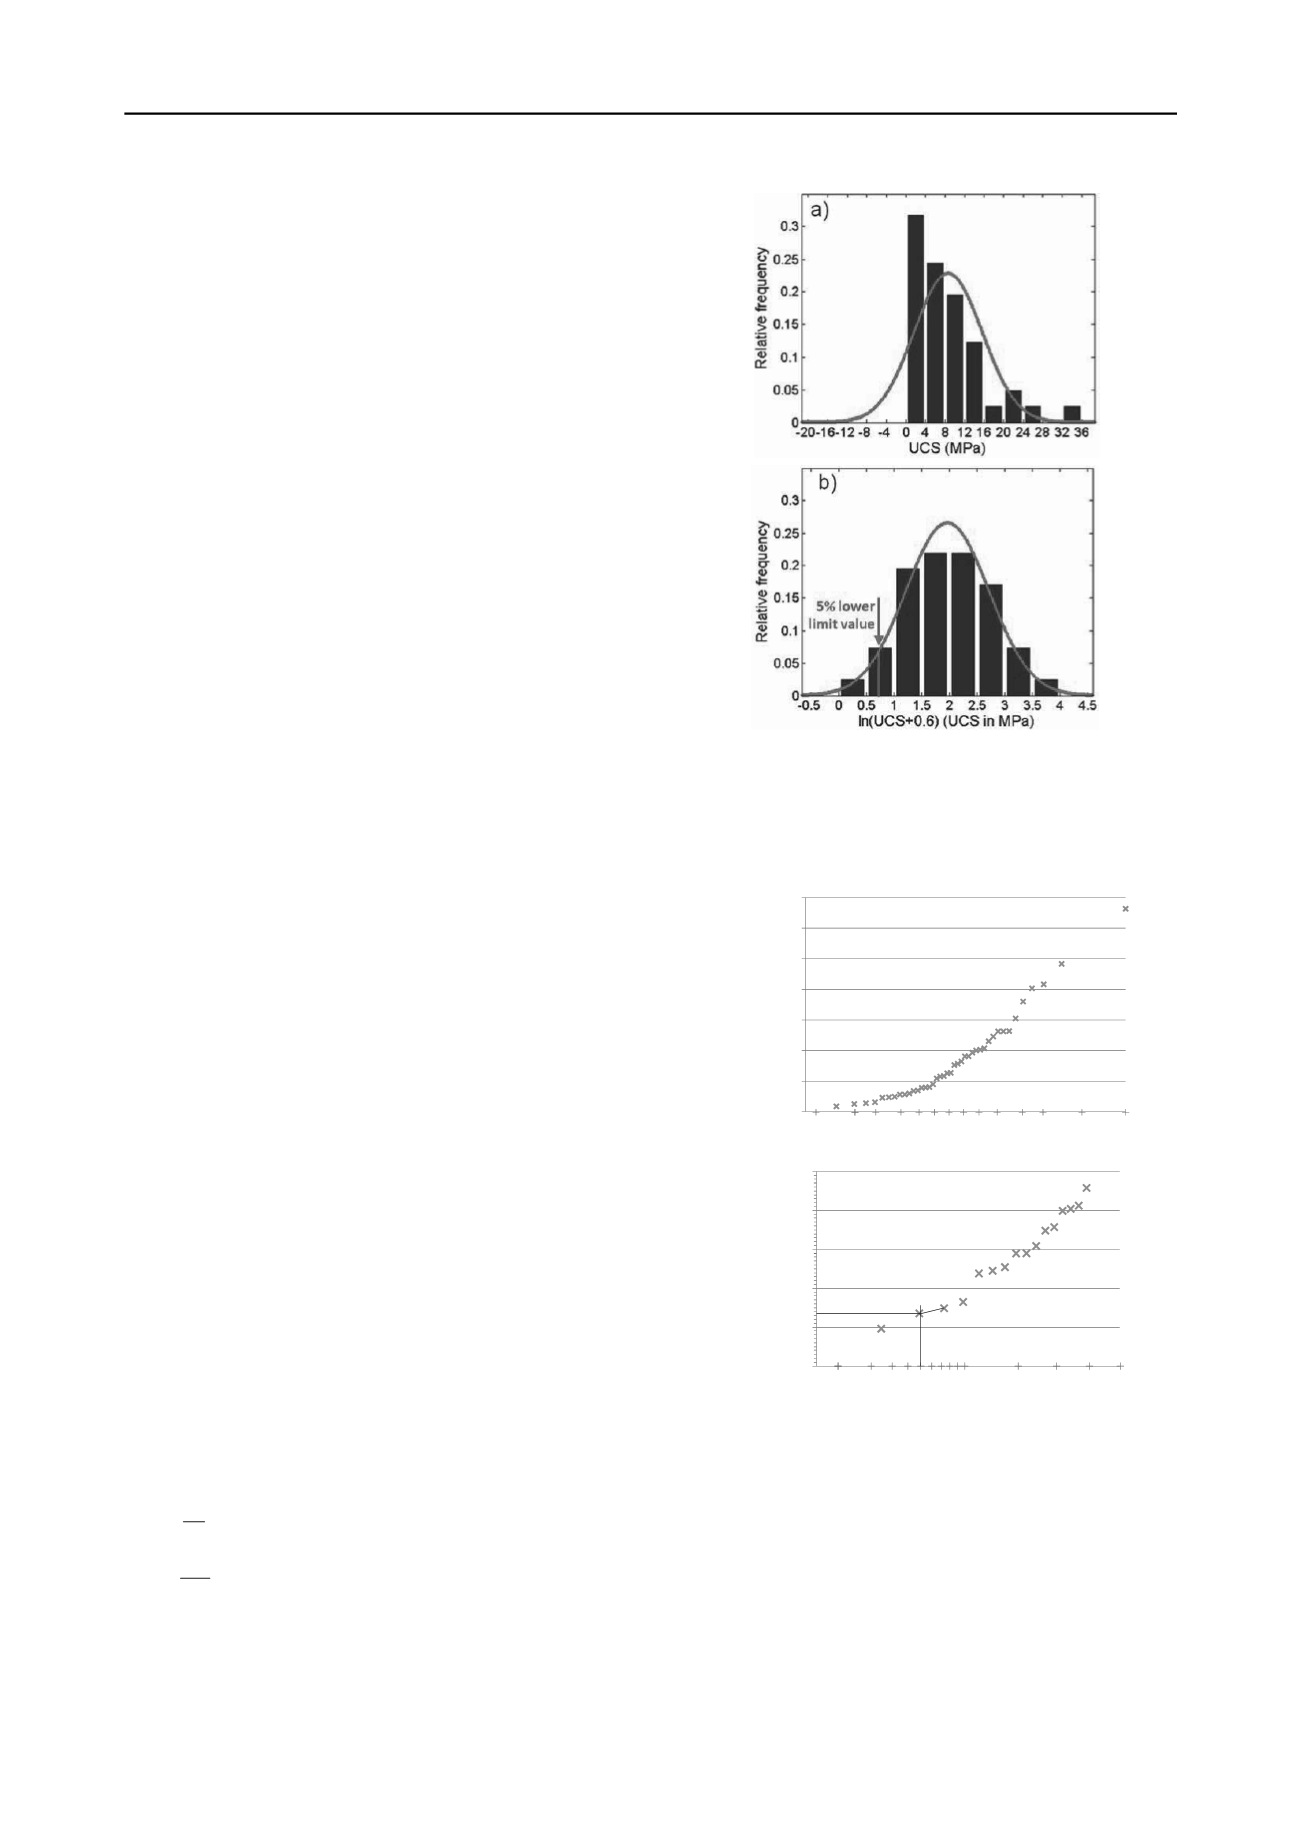
The first methodology consists in the calculation of the
characteristic strength as the X% lower limit on the basis of a
statistical distribution function. Nevertheless, in practice, the
wrong assumption is often made that the datasets of UCS values
of soil mix material are normally distributed (see Fig. 1a). The
characteristic UCS value is then erroneously calculated as the
X% lower quantile of the normal distribution with parameters
corresponding to the dataset. Moreover, this often results into
negative and thus useless characteristic UCS values. The
mathematically correct solution would be to apply the best
fitting standard distribution function, for example a lognormal
distribution in case the distribution is skewed and/or does not
contain subpopulations. The X% lower limit can then be
calculated on the basis of this theoretical distribution function,
as illustrated in Denies et al. (2012) for a lognormal distribution
(see Fig. 1b). Possibly, a factor β has to be added to the values
to obtain an optimal fit with a normal distribution after
transformation. However, this way of working is probably too
complex to apply in practical situations.
The second methodology to determine the X% lower limit is
based on the cumulative frequency curve of the original
experimental dataset and thus independent of any theoretical
distribution function. Note that to apply this method, enough
data points have to be available (for an accurate determination
of the 5% lower limit without extrapolation, at least 20 samples
are necessary). This approach seems rather simple but any other
method probably results in a large uncertainty. Figure 2 presents
the cumulative frequency curve for the UCS values of the
dataset illustrated in Fig. 1.
2.2
On the basis of an average value with safety factor
A second approach to determine the UCS characteristic value is
the use of the average value of the dataset in combination with a
safety factor:
uf
k,c
q
f
(1)
where
uf
q
is the mean UCS value and α a factor representing a
certain confidence and safety level (α < 1).
In the formalized design approach (DIN 4093, August 2012)
used in Germany, the UCS characteristic value is defined as the
minimum value of three parameters:
Figure 1. a) Distribution of the UCS values of 41 cores of DSM material
from a site in Gent (Belgium) and the corresponding theoretical
Gaussian curve. b) Distribution of the logarithm of the UCS values
increased with β = 0.6 from the same site and the corresponding
Gaussian curve. The vertical line indicates the 5% lower limit value,
after Denies et al. (2012).
a.
1 5 10
50
90
99
0
5
10
15
20
25
30
35
UCS (MPa)
Cumulative percentage
b.
1
5 10
50
0
1
2
3
4
5
UCS (MPa)
Cumulative percentage
Figure 2. Cumulative frequency curve of all UCS values of the dataset
from the site in Gent: a) Full curve. b) Zoom on the part below 50%:
presentation of the construction for the evaluation of the 5% lower limit
value.
MPa 12 ;
fα ;
f min
f
mittel
m,
minm,
kc,
(2)
where f
m,min
is the minimum UCS value and f
m,mittel
the
arithmetic mean UCS value from a series of at least 4 samples.
α is determined in function of f
c,k
: α equals 0.6 for f
c,k
≤ 4 MPa
and 0.75 for f
c,k
= 12 MPa (linear interpolation is required for
intermediate values). This method is described in more detail by
Topolnicki and Pandrea (2012).


