1339
Technical Committee 202 /
Comité technique 202
3 CPT/DMT CORRELATIONS FOR OCR
DETERMINATION
It is obvious that the values of overconsolidation ratio
determined from both CPT and DMT tests should be the same.
Therefore, the following equation is valid:
561
50
240
.
D
1,25
vo
vo
c
K .
σ'
σ q .
(5)
In order to determine CPT/DMT correlations the statistical
analysis (Solver modulus) to obtain the best fitting between
calculated according to equation (1) and measured values of K
D
in the SGGW Campus was applied. From statistical analysis the
following relationship was estimated with Mean and Maximum
Relative Deviations respectively MSRD=9,0%, MRD=20,0%:
0,40
vo
vo
c
D
σ'
σ q ,1 K
2
(6)
The similar statistical analysis was carried out for obtaining
the best fitting of q
c
distribution in profile of the SGGW
Campus between calculated according to eq. (6) and measured
values. Equation (6) was rearranged to determine the q
c
values.
The following relationship was determined with MSRD=20,0%,
MRD=30,0%:
vo
2,0
D vo
c
σ Kσ'
0,45
q
(7)
Finally, introducing to formula (eq.1) the proposed relationships
(eq.6 and eq.7) the overcondsolidation ratio can be calculated
using the following formulas:
0.82
vo
vo
c
σ'
σ q .0 CRO
28
(8)
21
48
.
D
K .0 CRO
(9)
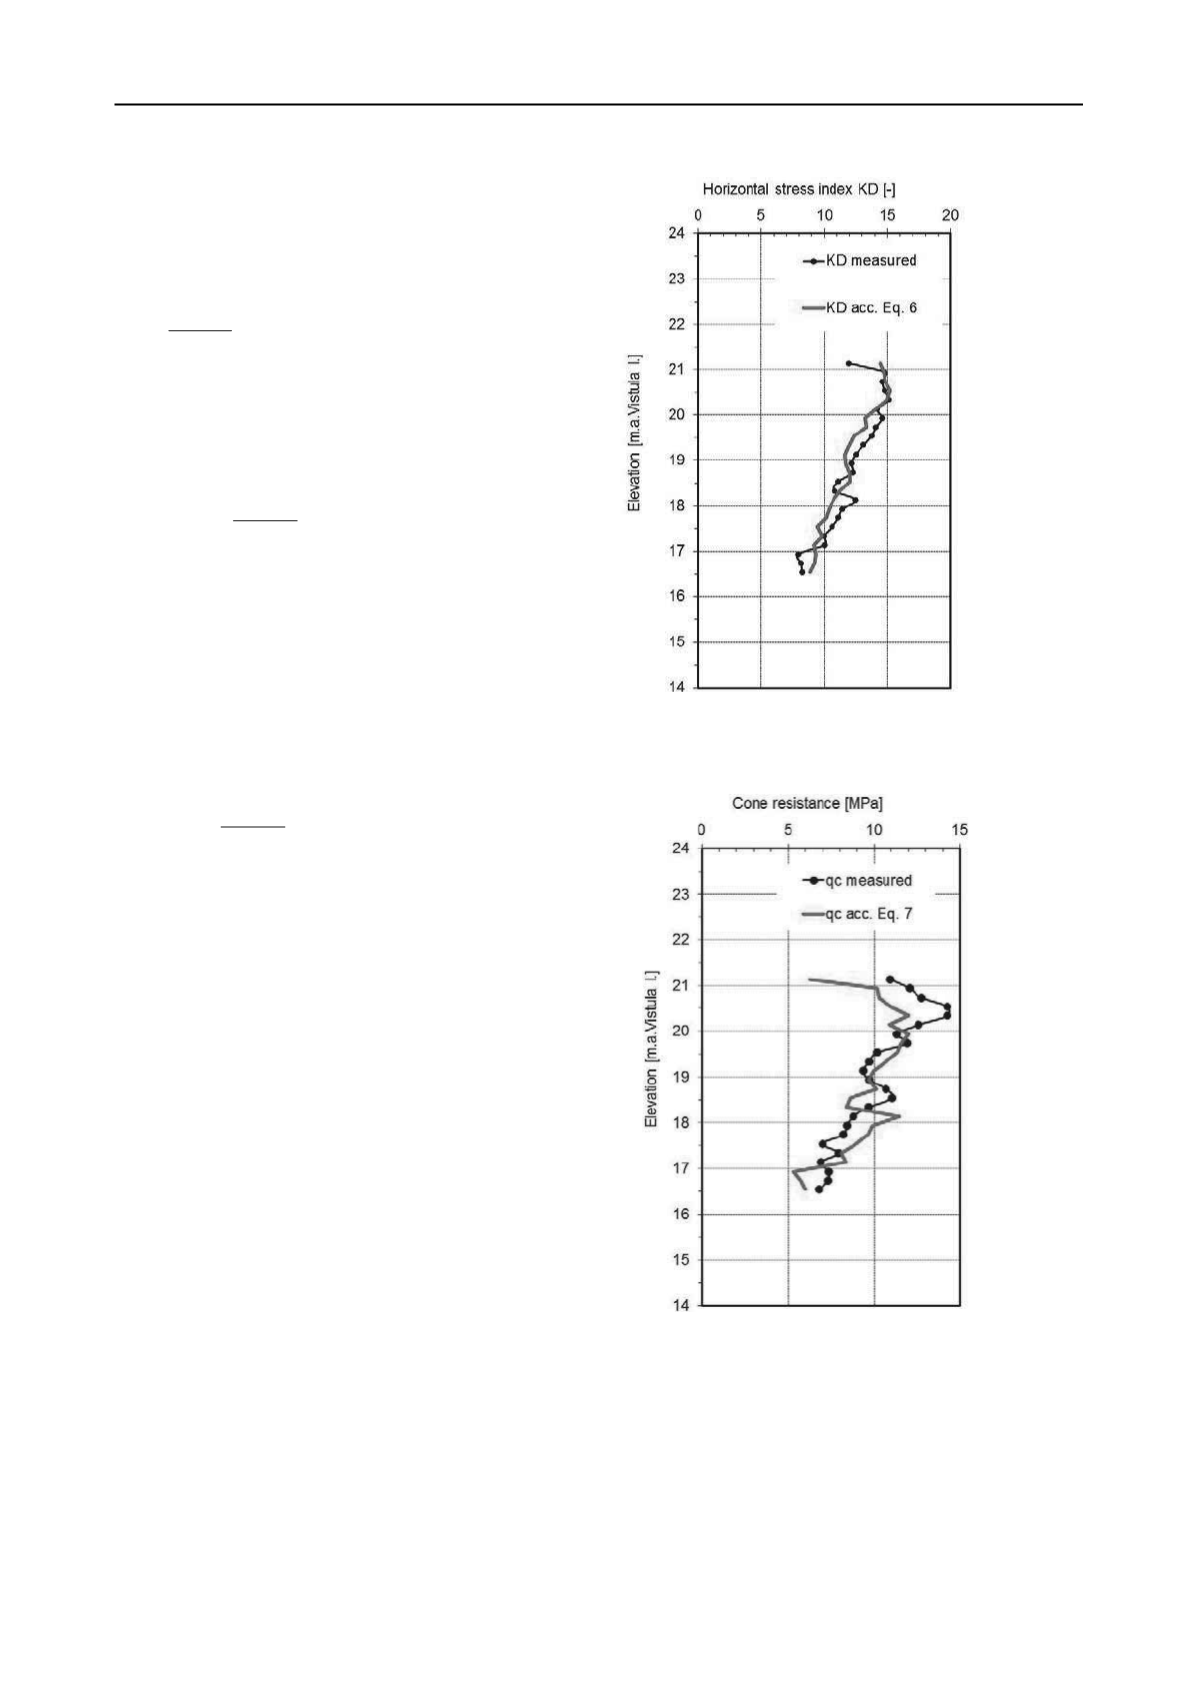
Comparison between K
D
measured in the foundation of building
No 34 in SGGW Campus and calculated using equations (eq.1)
and (6) is presented in figure 7, whereas between q
c
measured
and calculated according to equation 7 in figure 8. The values of
K
D
and q
c
calculated according to eq. (6) (7) are similar to
measured. The distribution of OCR values in profile analysed is
shown in figure 9.
4 FINAL CONCLUSIONS
The objective of this paper is to compare the results of CPT and
DMT tests obtained for boulder clay distinguished in SGGW
Campus at Warsaw. Based on the statistical analyses of 69
CPT/DMT profiles the formulas for the cone resistance q
c
as a
function of horizontal stress index K
D
and for K
D
as a function
of q
c
were suggested. Moreover, the new formulas for
determination of overconsolidation ratio are also proposed.
In general, the formulas proposed for boulder clay in
foundation of SGGW Campus give smaller values of OCR to
comparison with Robertson’s proposal.
The suggested relationships should be considered in
future analyses for their improvement.
Figure
Profile of K
D
under SGGW building No 34
in Warsaw SGGW Campus
Figure
Profile of q
c
under SGGW building No 34 in Warsaw
SGGW Campus


