 
          1091
        
        
          Technical Committee 106 /


            Comité technique 106


          4 RESULTS
        
        
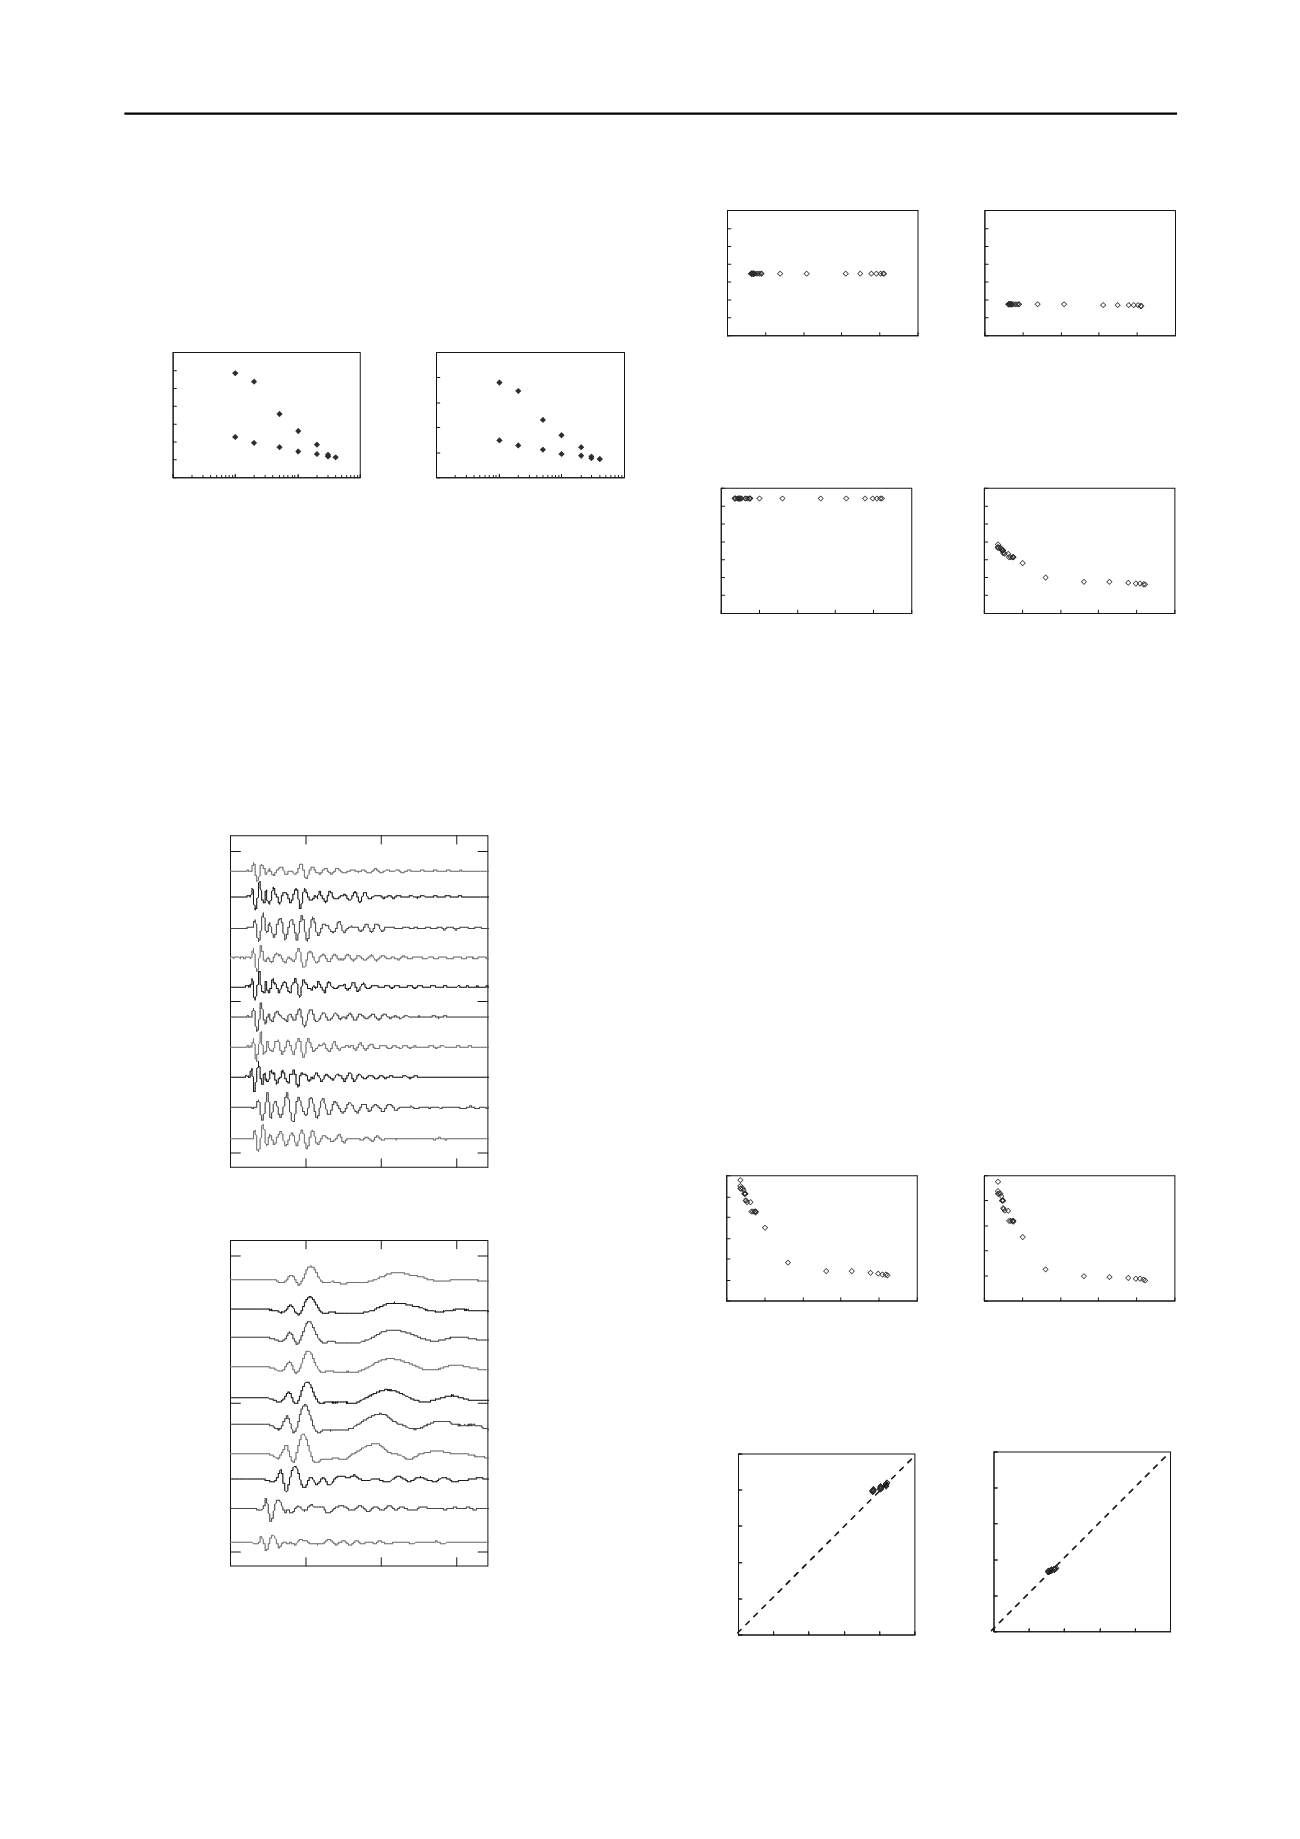
          The matric suction versus volumetric water content, which is
        
        
          called the soil water characteristic curve (SWCC), is plotted in
        
        
          Figure 2 for the sand specimen.
        
        
          (a)
        
        
          (b)
        
        
          Figure 2. Sand specimen (a) volumetric water content versus matric
        
        
          suction; (b) degree of saturation versus matric suction.
        
        
          Figure 2 shows that both the volumetric water content and the
        
        
          degree of saturation gradually decrease as the matric suction
        
        
          increases.
        
        
          Elastic waves for the sand
        
        
          –
        
        
          silt mixture are plotted in Figure
        
        
          3. Similar results were obtained for the sand specimen. The
        
        
          elastic wave velocities determined from the measured waves are
        
        
          plotted against the degree of saturation in Figure 4 for the sand
        
        
          specimen and Figure 5 for the sand
        
        
          –
        
        
          silt specimen.
        
        
          Figure 3. Measured elastic waves for the sand
        
        
          –
        
        
          silt mixture: (a)
        
        
          compression waves; (b) shear waves.
        
        
          (a)
        
        
          (b)
        
        
          Figure 4. Elastic wave velocities versus degree of saturation for the sand
        
        
          specimen: (a) compression wave velocity; (b) shear wave velocity.
        
        
          (a)
        
        
          (b)
        
        
          Figure 5. Elastic wave velocity versus degree of saturation for the sand
        
        
          –
        
        
          silt mixture specimen: (a) compression wave velocity; (b) shear wave
        
        
          velocity.
        
        
          The compression and shear waves for the sand specimen
        
        
          remained almost constant for degrees of saturation from 15 to
        
        
          85%, as shown in Figure 4. For the sand
        
        
          –
        
        
          silt mixture specimen,
        
        
          the compression wave velocity also remained constant as the
        
        
          degree of saturation decreased from 85% to 7%. The shear wave
        
        
          velocity of the sand
        
        
          –
        
        
          silt mixture, however, increased as the
        
        
          degree of saturation decreased, as shown in Figure 5(b).
        
        
          5 ANALYSES
        
        
          The elastic modulus and the shear modulus of each specimen
        
        
          can be estimated using the measured elastic wave velocities.
        
        
          The calculated elastic moduli based on Equations (2) and (3) are
        
        
          plotted in Figure 6 for the sand
        
        
          –
        
        
          silt mixture specimen. From the
        
        
          measured elastic wave velocities and Equation (5), the porosity
        
        
          can be estimated. The calculated wave-based void ratio versus
        
        
          volumetric void ratio is plotted in Figure 7. Figure 7 shows that
        
        
          the wave-based void ratio is similar to the volumetric void ratio.
        
        
          (a)
        
        
          (b)
        
        
          Figure 6. Elastic moduli versus degree of saturation for sand
        
        
          –
        
        
          silt
        
        
          mixture specimen: (a) Young
        
        
          ’
        
        
          s modulus; (b) shear modulus.
        
        
          (a)
        
        
          (b)
        
        
          Figure 7. Wave-based void ratio versus volumetric void ratio: (a) sand
        
        
          specimen; (b) sand
        
        
          –
        
        
          silt mixture specimen.
        
        
          0
        
        
          100
        
        
          200
        
        
          300
        
        
          400
        
        
          500
        
        
          600
        
        
          700
        
        
          0 20 40 60 80 100
        
        
          Degree of saturation,%
        
        
          P-wave velocity,m/sec
        
        
          .
        
        
          0
        
        
          100
        
        
          200
        
        
          300
        
        
          400
        
        
          500
        
        
          600
        
        
          700
        
        
          0 20 40 60 80 100
        
        
          Degree of saturation,%
        
        
          S-wave velocity,m/sec
        
        
          .
        
        
          0
        
        
          100
        
        
          200
        
        
          300
        
        
          400
        
        
          500
        
        
          600
        
        
          0 20 40 60 80 100
        
        
          Degree of saturation,%
        
        
          Young's modulus, MPa
        
        
          .
        
        
          0
        
        
          50
        
        
          100
        
        
          150
        
        
          200
        
        
          250
        
        
          0 20 40 60 80 100
        
        
          Degree of saturation,%
        
        
          Shear modulus, MPa
        
        
          .
        
        
          0
        
        
          5
        
        
          10
        
        
          15
        
        
          20
        
        
          25
        
        
          30
        
        
          35
        
        
          1
        
        
          10
        
        
          100
        
        
          1000
        
        
          Matric suction, kPa
        
        
          Volumetric water content,%
        
        
          0
        
        
          20
        
        
          40
        
        
          60
        
        
          80
        
        
          100
        
        
          1
        
        
          10
        
        
          100
        
        
          1000
        
        
          Matric suction, kPa
        
        
          Degree of saturation, %
        
        
          (a)
        
        
          0
        
        
          0.5
        
        
          1
        
        
          1.5
        
        
          20


          10


          0
        
        
          1min
        
        
          4min
        
        
          9min
        
        
          16min
        
        
          25min
        
        
          1hr
        
        
          2hr
        
        
          4hr
        
        
          6hr
        
        
          24hr
        
        
          time [ms]
        
        
          (b)
        
        
          0
        
        
          0.5
        
        
          1
        
        
          1.5
        
        
          20


          10


          0
        
        
          1min
        
        
          4min
        
        
          9min
        
        
          16min
        
        
          25min
        
        
          1hr
        
        
          2hr
        
        
          4hr
        
        
          6hr
        
        
          24hr
        
        
          time [ms]
        
        
          0
        
        
          100
        
        
          200
        
        
          300
        
        
          400
        
        
          500
        
        
          600
        
        
          700
        
        
          0 20 40 60 80 100
        
        
          Degree of saturation,%
        
        
          P-wave velocity,m/sec
        
        
          .
        
        
          0
        
        
          100
        
        
          200
        
        
          300
        
        
          400
        
        
          500
        
        
          600
        
        
          700
        
        
          0 20 40 60 80 100
        
        
          Degree of saturation,%
        
        
          S-wave velocity,m/sec
        
        
          .
        
        
          0.55
        
        
          0.60
        
        
          0.65
        
        
          0.70
        
        
          0.75
        
        
          0.80
        
        
          0.55 0.60 0.65 0.70 0.75 0.80
        
        
          Volumetric void ratio
        
        
          Wave based void ratio
        
        
          .